
Totalities (2019-)
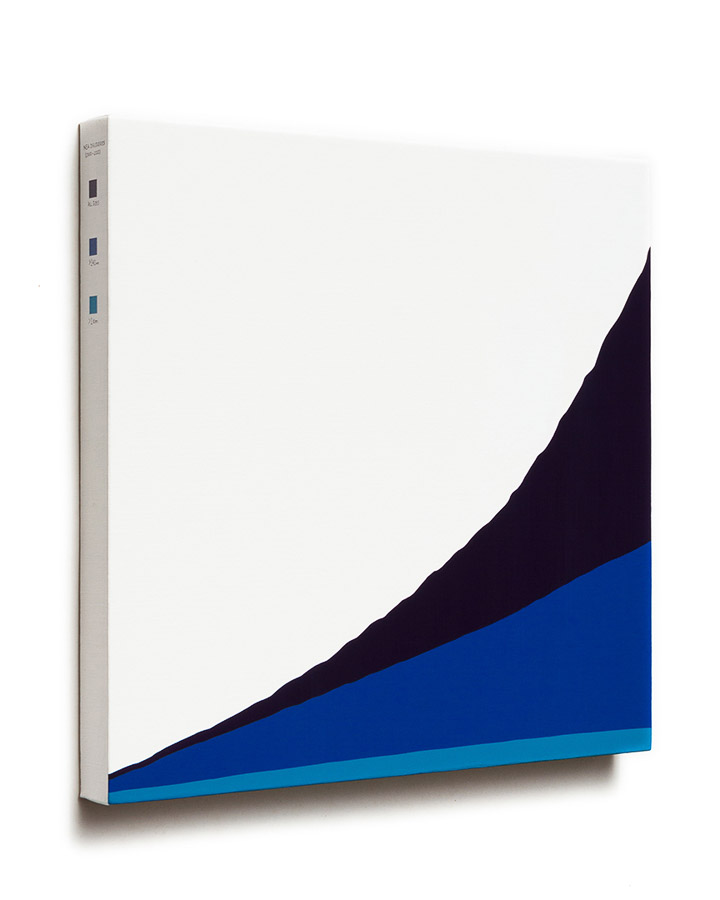
Totalities is a series of paintings that presents abstract fields of color informed by regimes of accumulation, transfer, and extraction of capital using data visualization techniques.
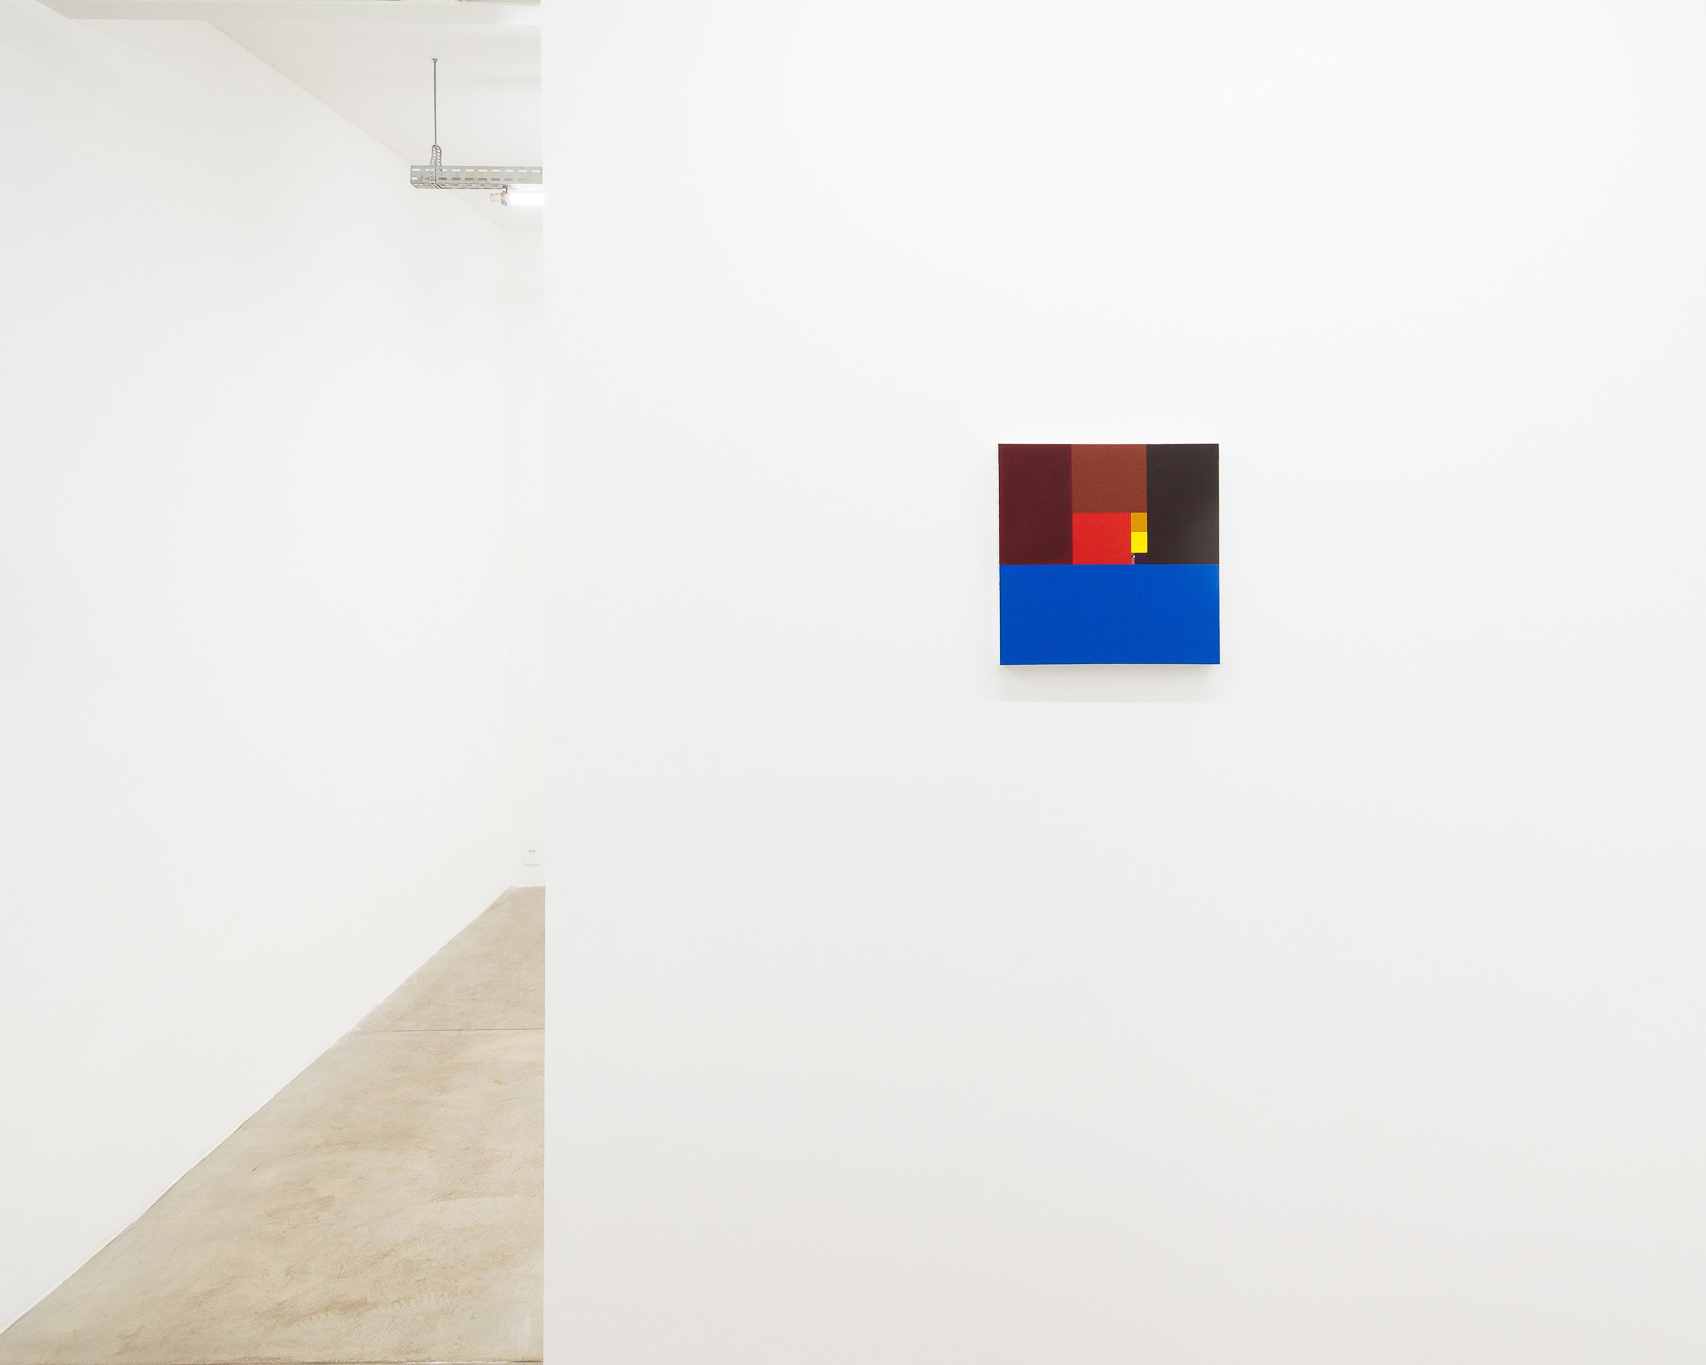
Untitled #1 brings together a selection of data about the global economy in 2018. The blue field corresponds to the derivatives market and takes up most of the canvas, reflecting the broad reach of this type of financial instrument. The data comes from various sources, including datasets from the World Bank, Bloomberg, Coinmarketcap, the Ministry of Economy in Brazil, among others.
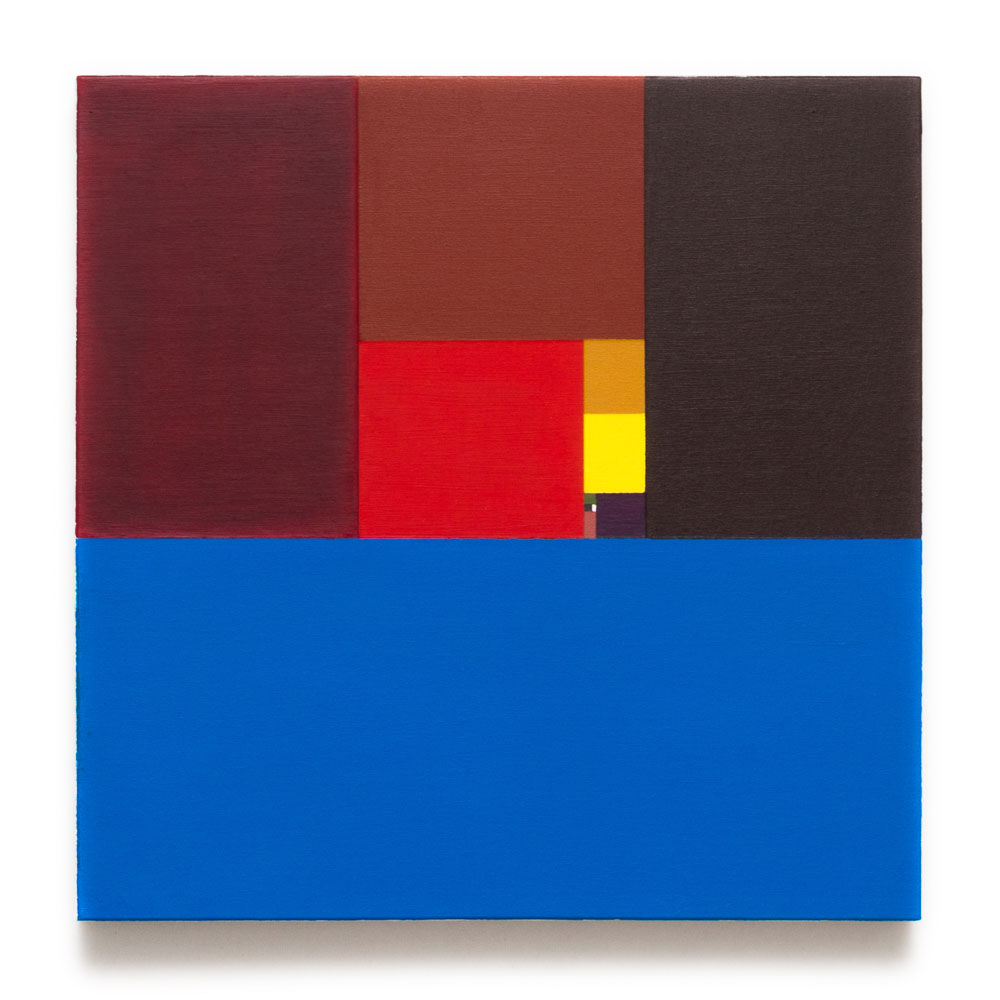
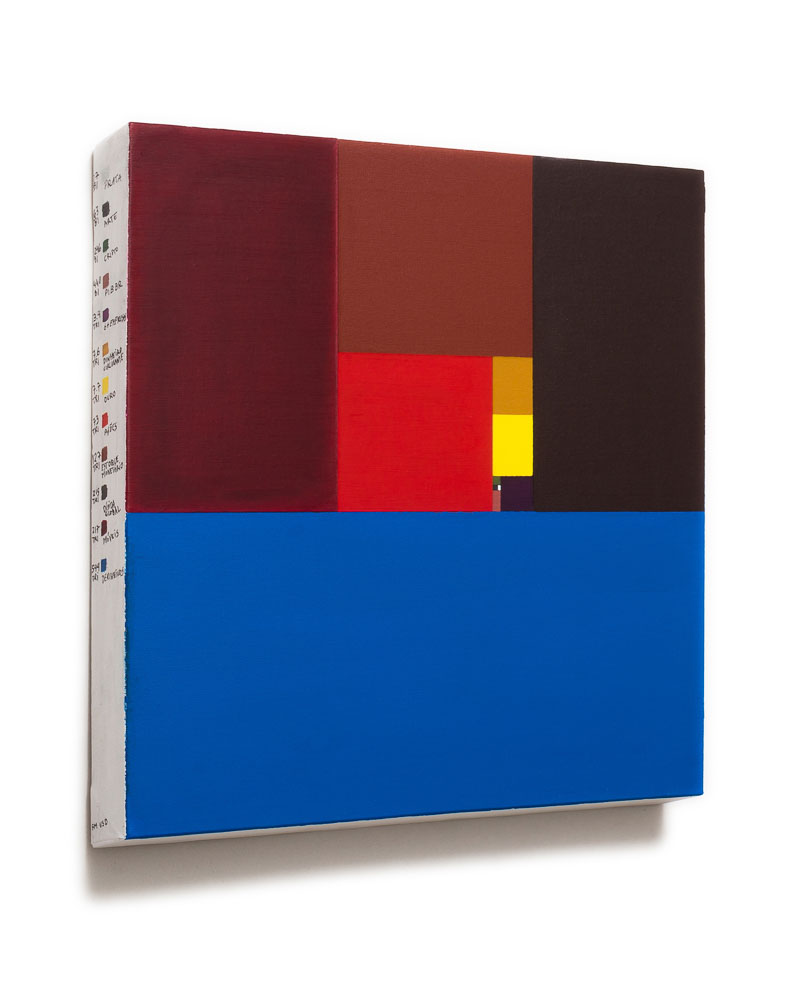

Untitled #1 (Total Capitalization in 2018)
acrylics, ink marker and varnish on canvas
40×40 cm
2019
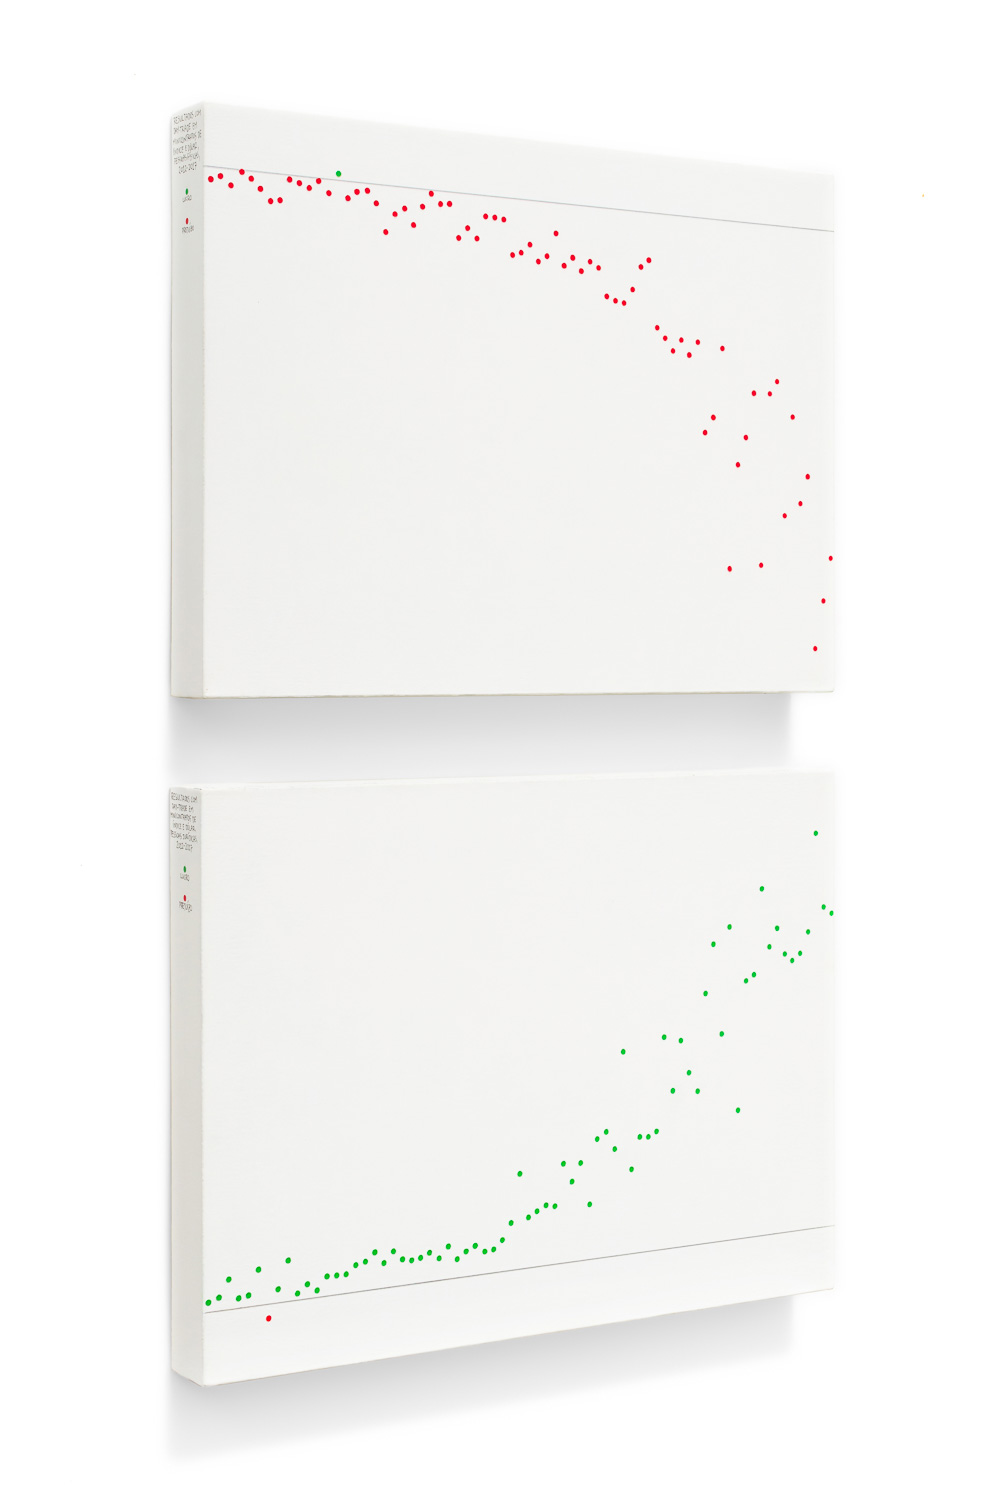
Untitled #2 is composed of a diptych gathering information on the art trade between different countries over 10 years. The data was obtained with the World Trade Organization.

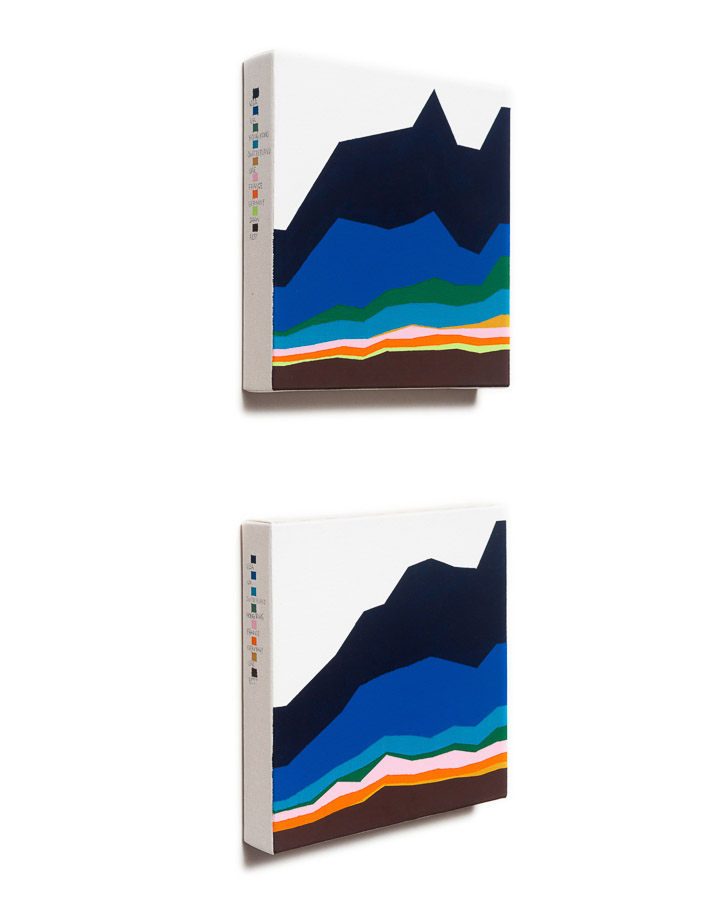
Untitled #2 (World’s imports and exports, works of art, HS97, 2009-2018)
acrylics, ink marker and varnish on canvas
diptych, 20×20 cm (each)
2019
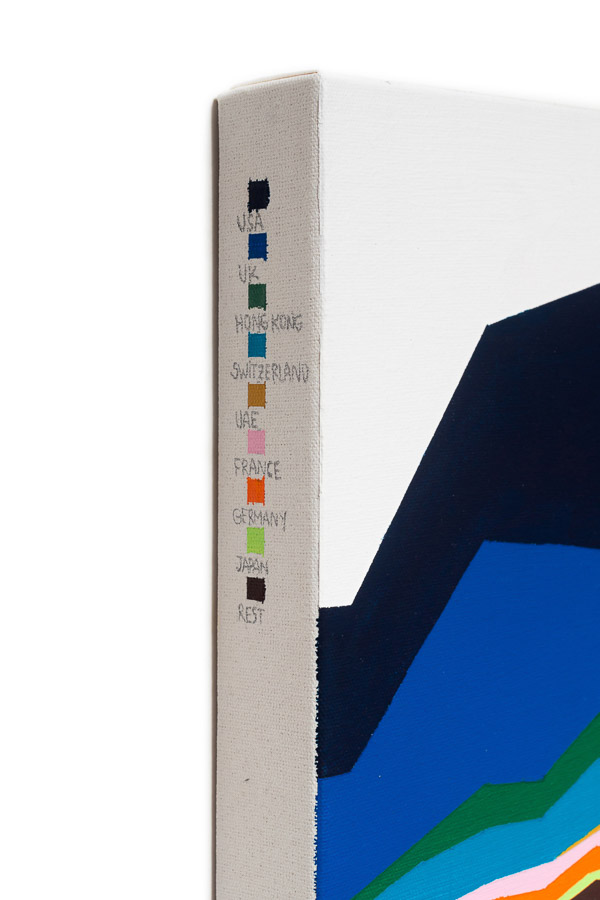
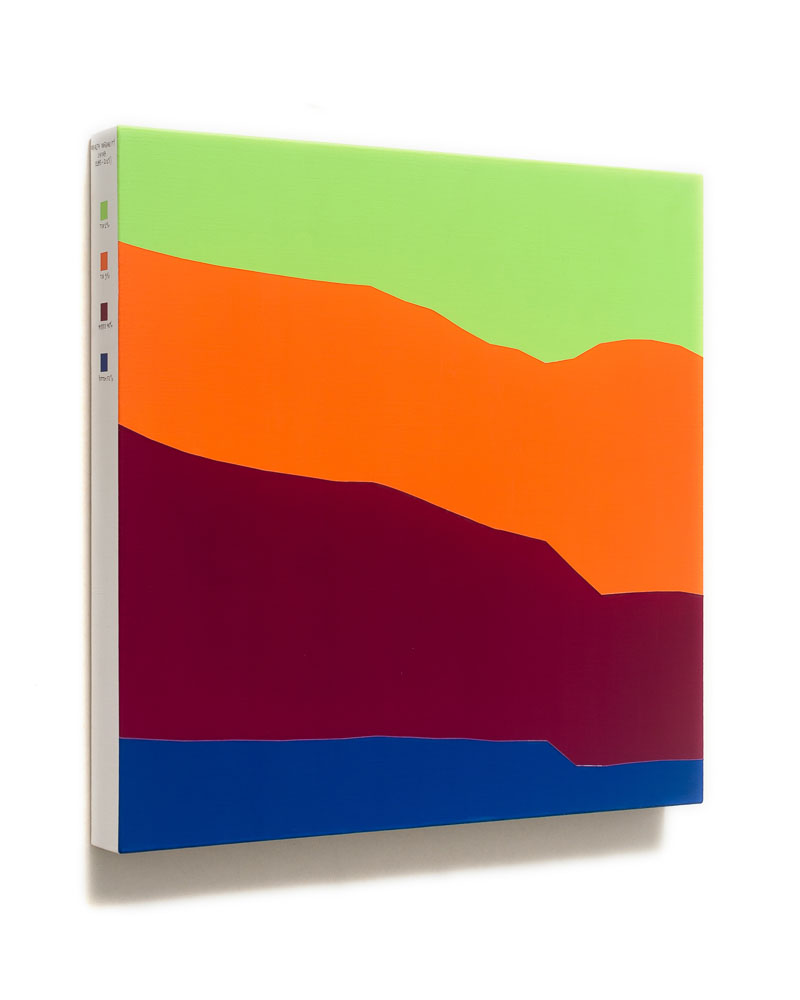
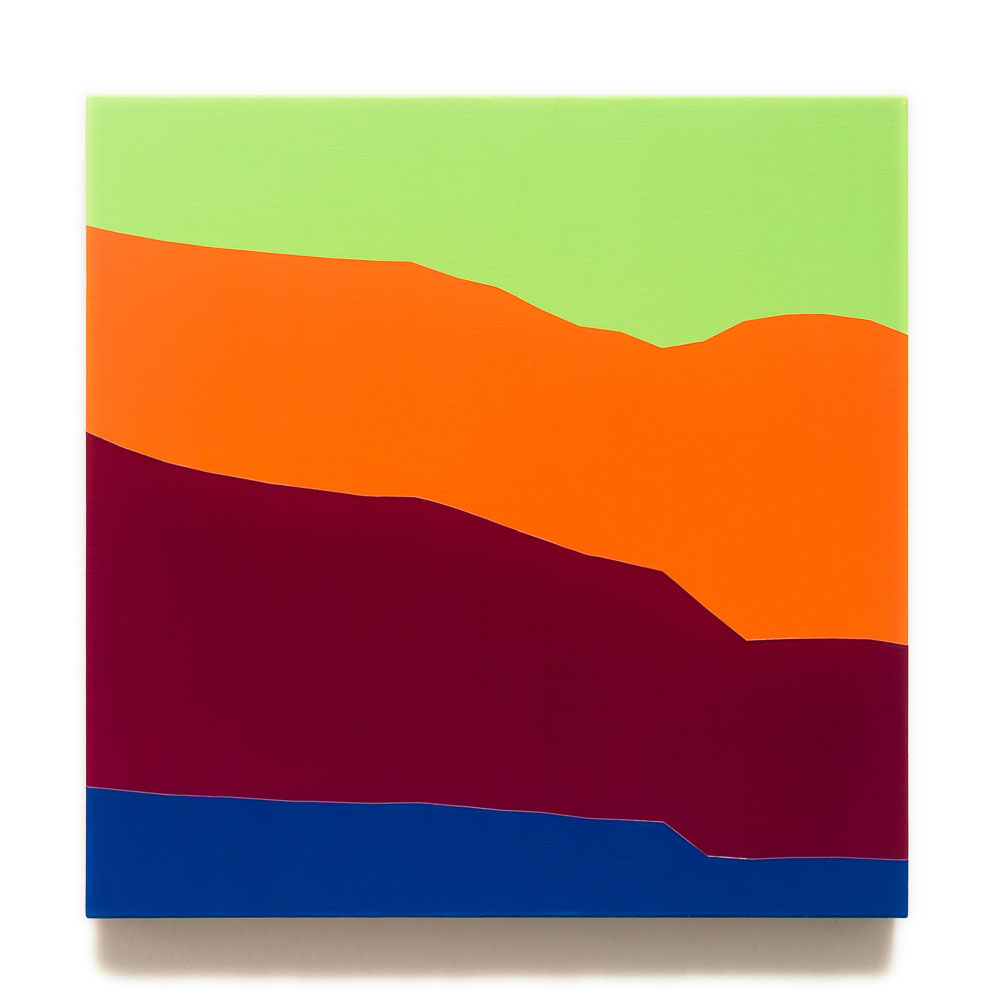
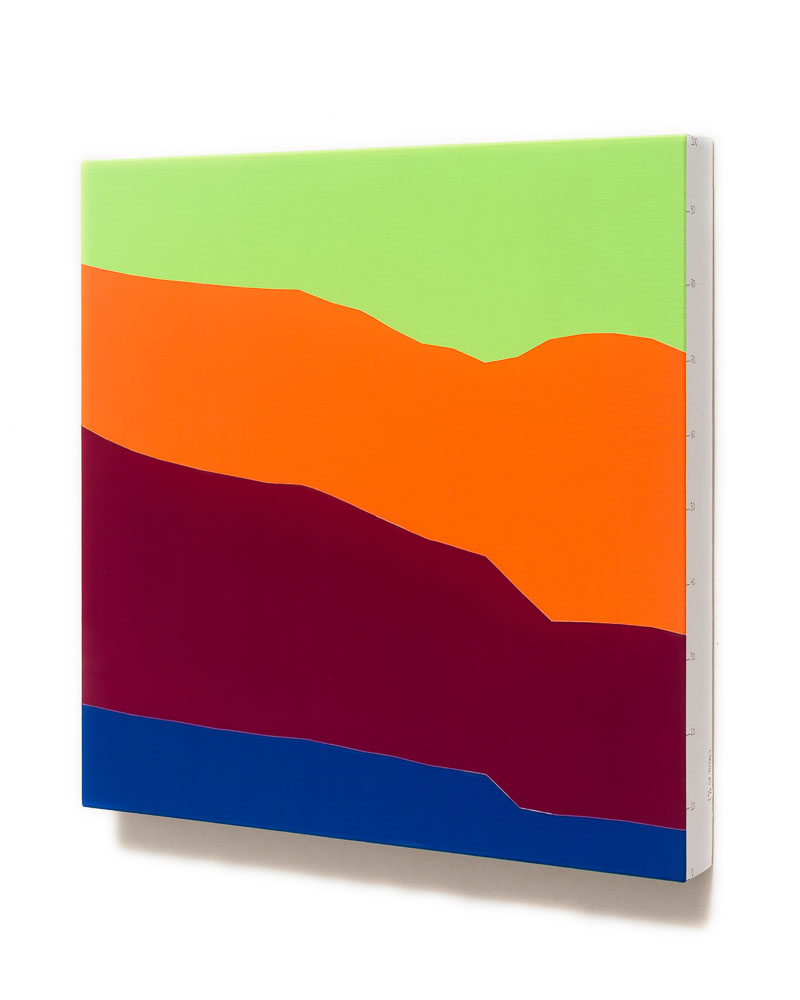
Untitled #3 points to a change in the distribution of wealth among macro-regions of the world over a period of more than 300 years, including temporal highlights, and also a forecast that reaches the year 2030, where it is noted a return of Chinese hegemony in the global economic scenario, with data from OECD Publishing.
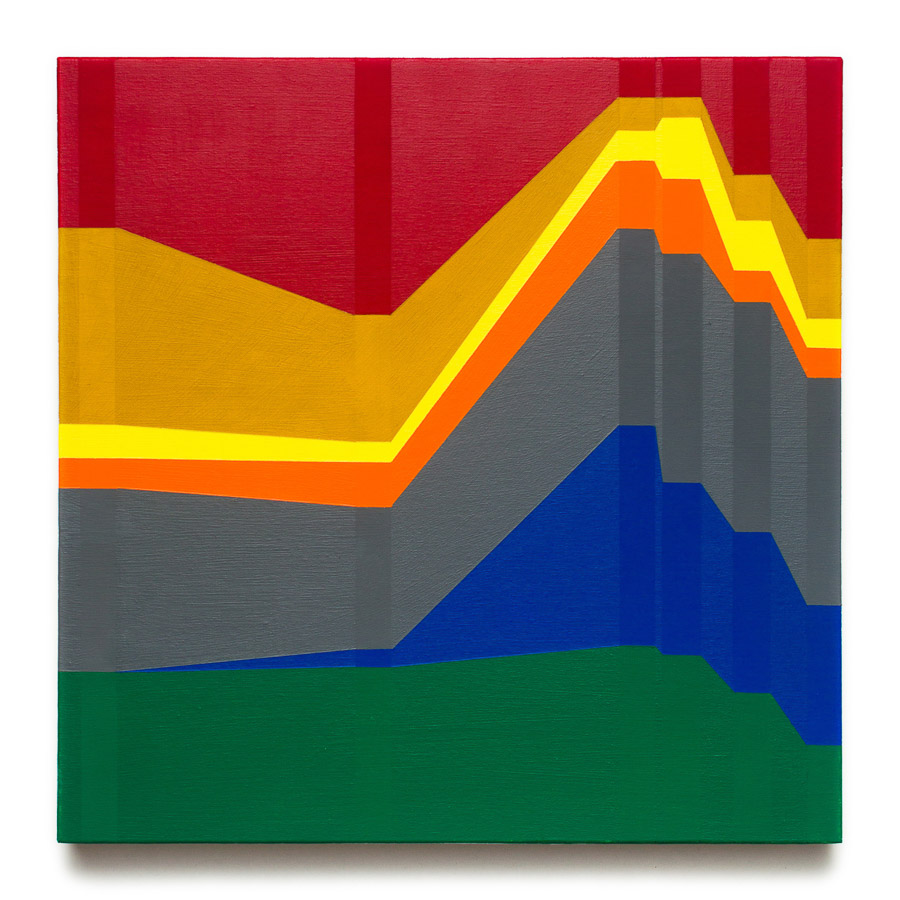


Untitled #3 (Shares of world GDP, 1800-2030)
acrylics, ink marker and varnish on canvas
40×40 cm
2019
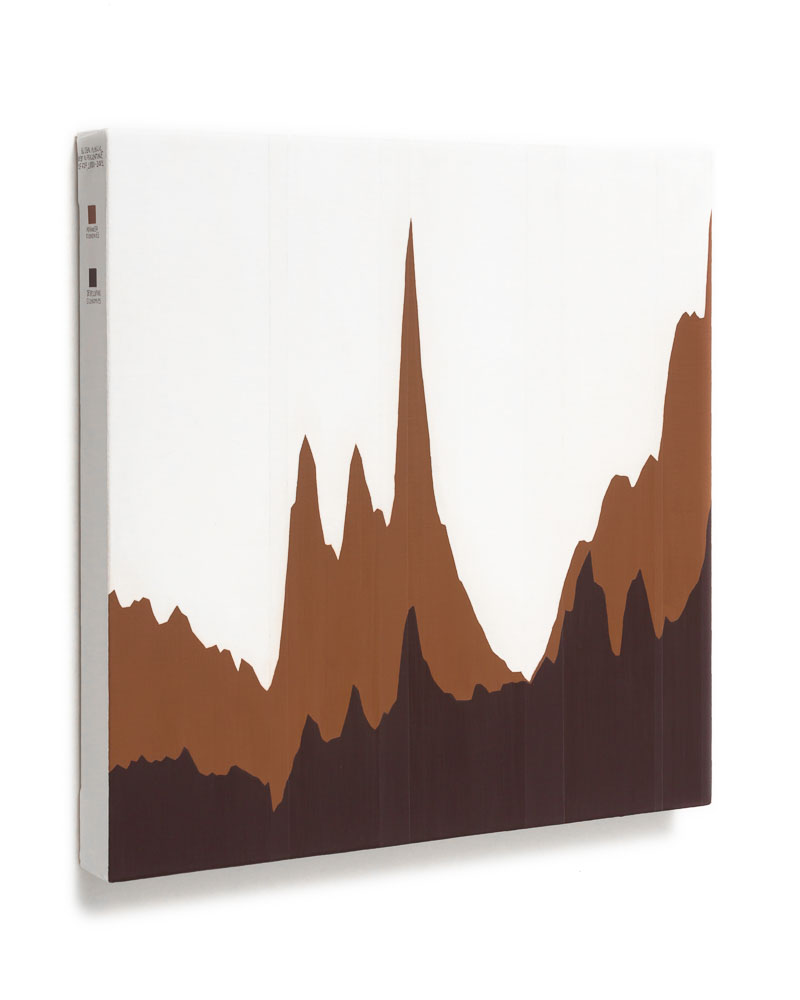
Untitled #4 returns to a topic addressed in a 2016 essay (On exo-economics, published in the compilation Between Crowds and Empires) as a critique of mineral extraction in celestial bodies, something that would indicate drastic economic and ecological changes. In this treemap the colored fields show the dollar valuation of asteroids close to the Earth, while the black fields show the possible profit share from the extraction of rare metals and water, according to the website asterank.com.

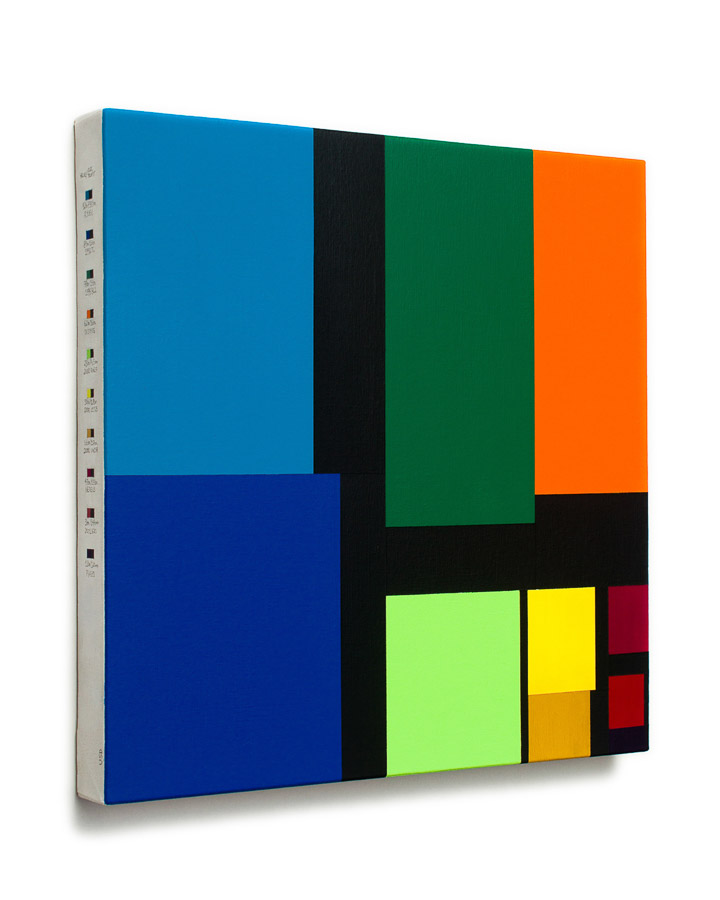
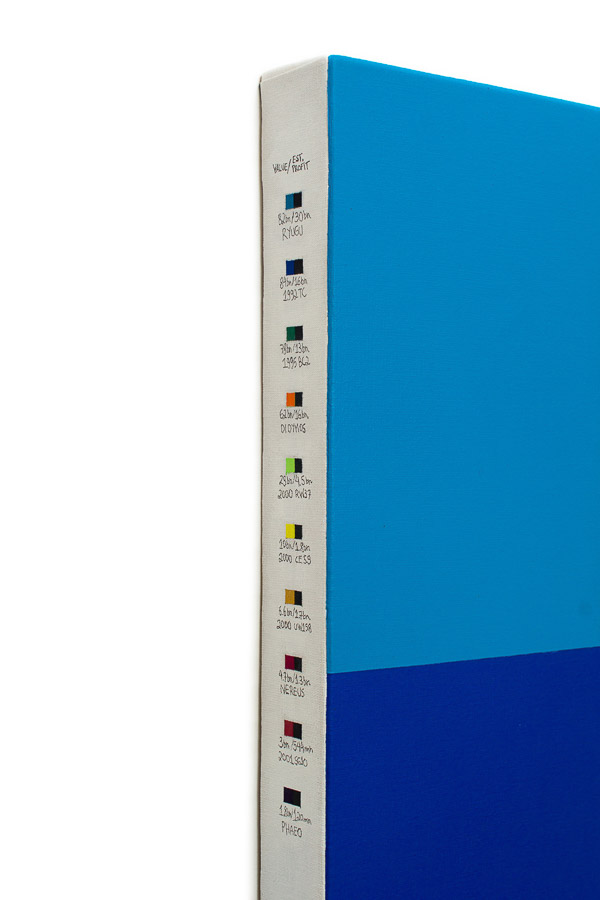
Untitled #4 (Value and estimated profit of 10 most cost-effective asteroids for mining)
acrylics, ink marker and varnish on canvas
40×40 cm
2019
Untitled #5 also addresses the field of exo-economics, noting the value attributed to what would be the most valuable asteroid ever discovered. Valued at 15.38 quintillion dollars, Davida could generate a net profit of 1.06 quintillion. The lime green field serves as a scale by simulating the distribution of a fraction of that profit as basic income for all earthlings for 50 years.
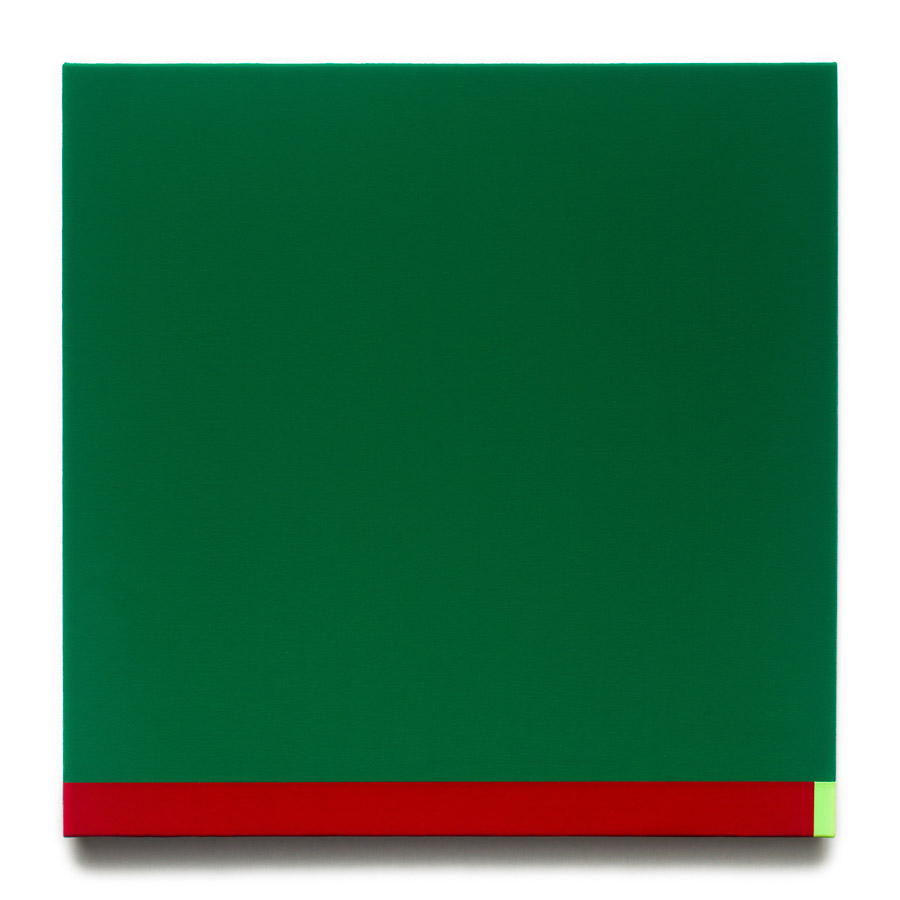
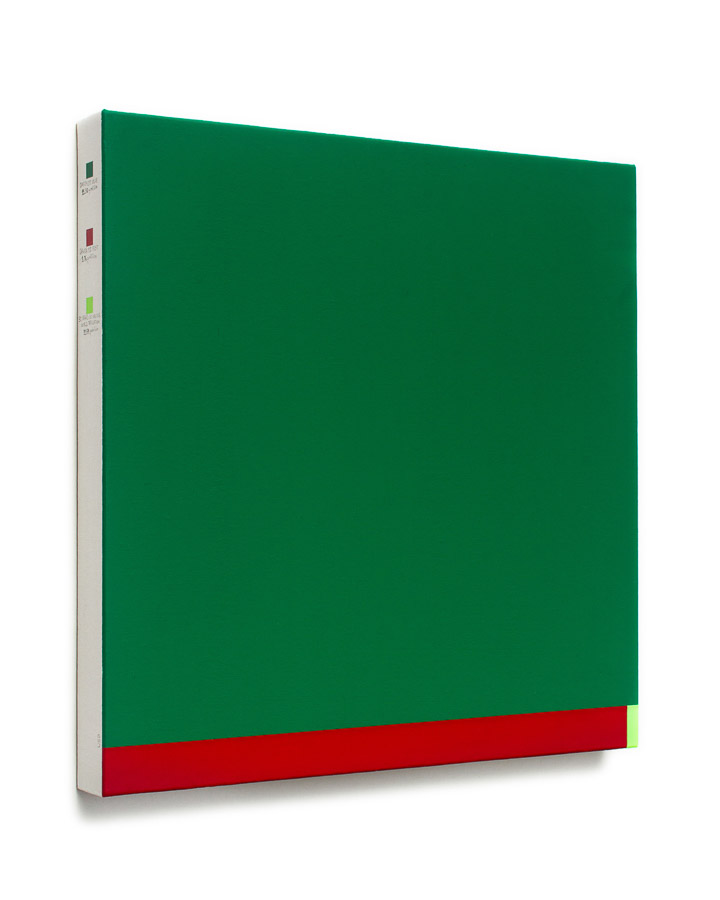
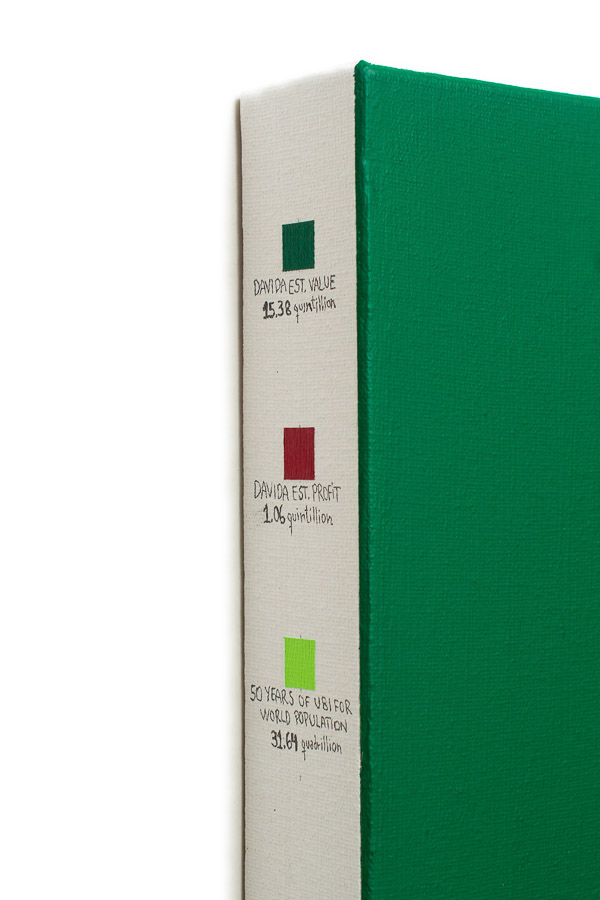
Untitled #5 (Estimated value and profit of asteroid 511 Davida (1903 LU) X Universal basic income for world population of USD 5000 per month for 50 years)
acrylics, ink marker and varnish on canvas
40×40 cm
2019
Untitled #6 uses information from NASA’s Center for Near-Earth Objects Studies showing the 20-year increase in the discovery of celestial bodies orbiting us, an information used by companies that are prospecting for asteroid mining to validate their extractive missions.

Untitled #6 (Near-earth asteroids discoveries, 2000-2020)
acrylics, ink marker and varnish on canvas
40×40 cm
2019
Untitled #7 is a diptych with information about the trade of works of art made to/ from Brazil. Data from the World Trade Organization.
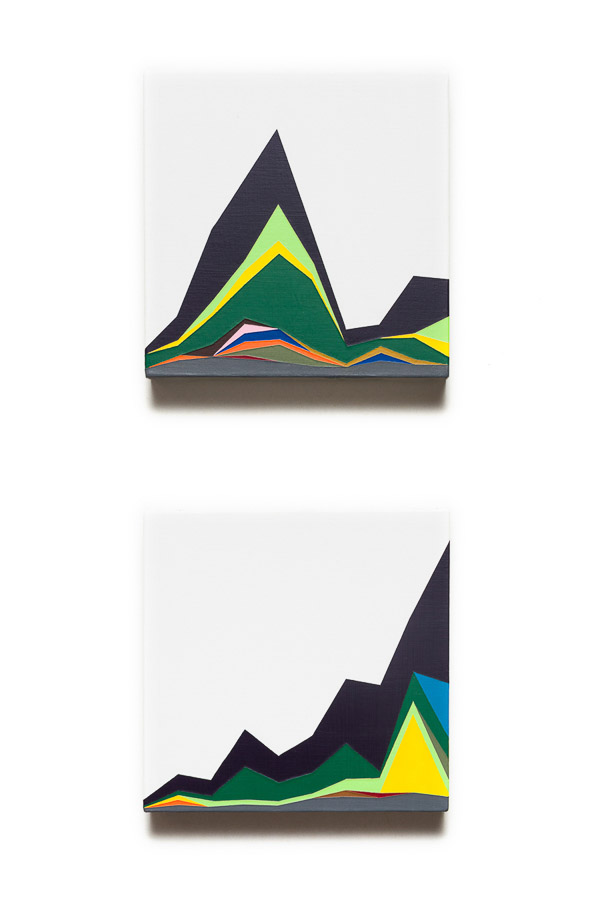
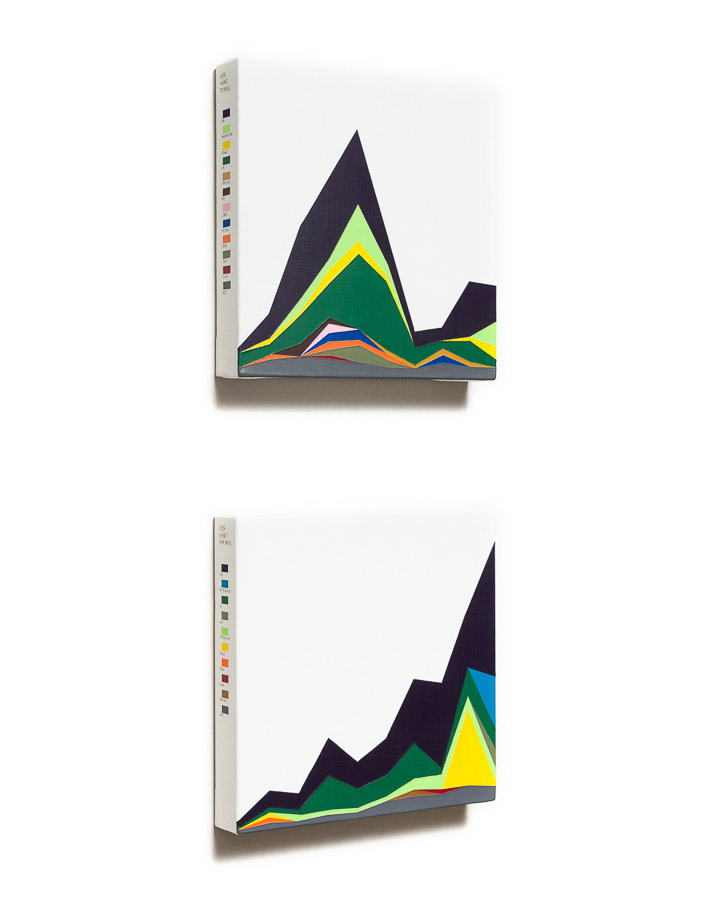
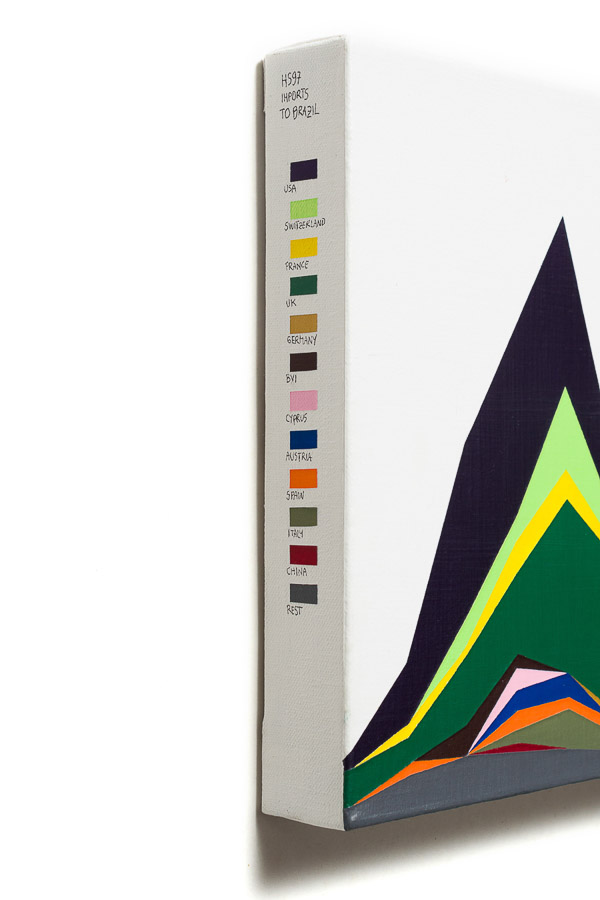
Untitled #7 (Brazilian imports and exports, works of art, HS97, 2010-2019)
acrylics, ink marker and varnish on canvas
diptych, 20×20 cm (each)
2019
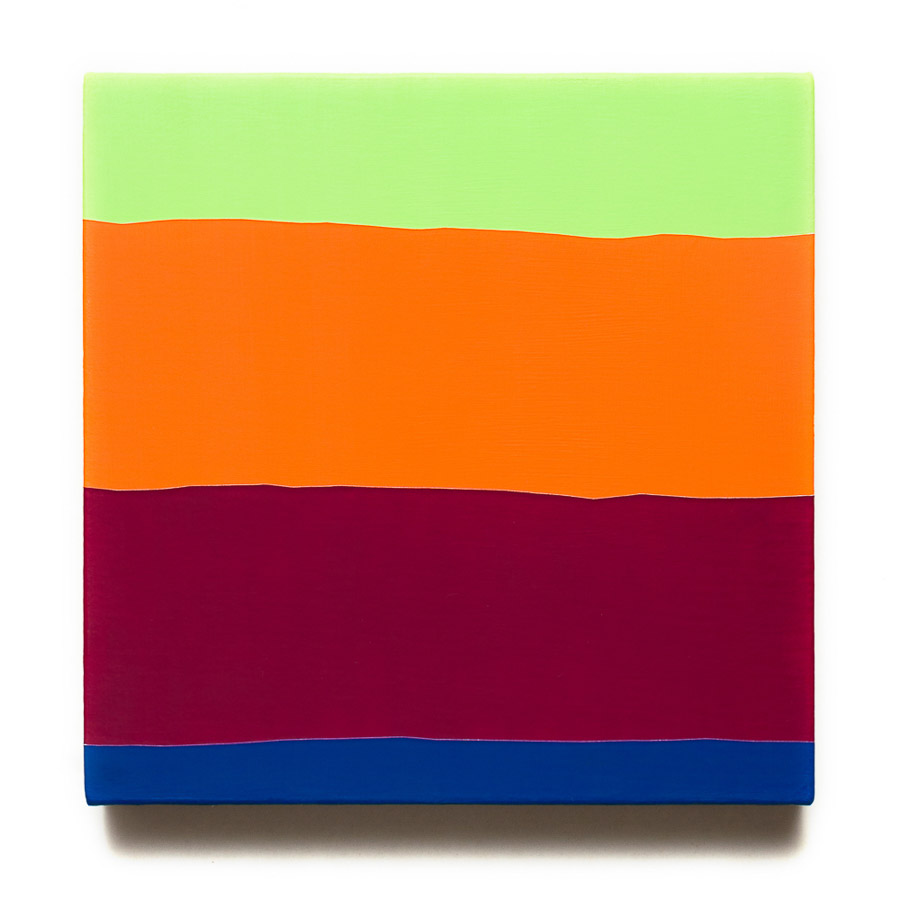
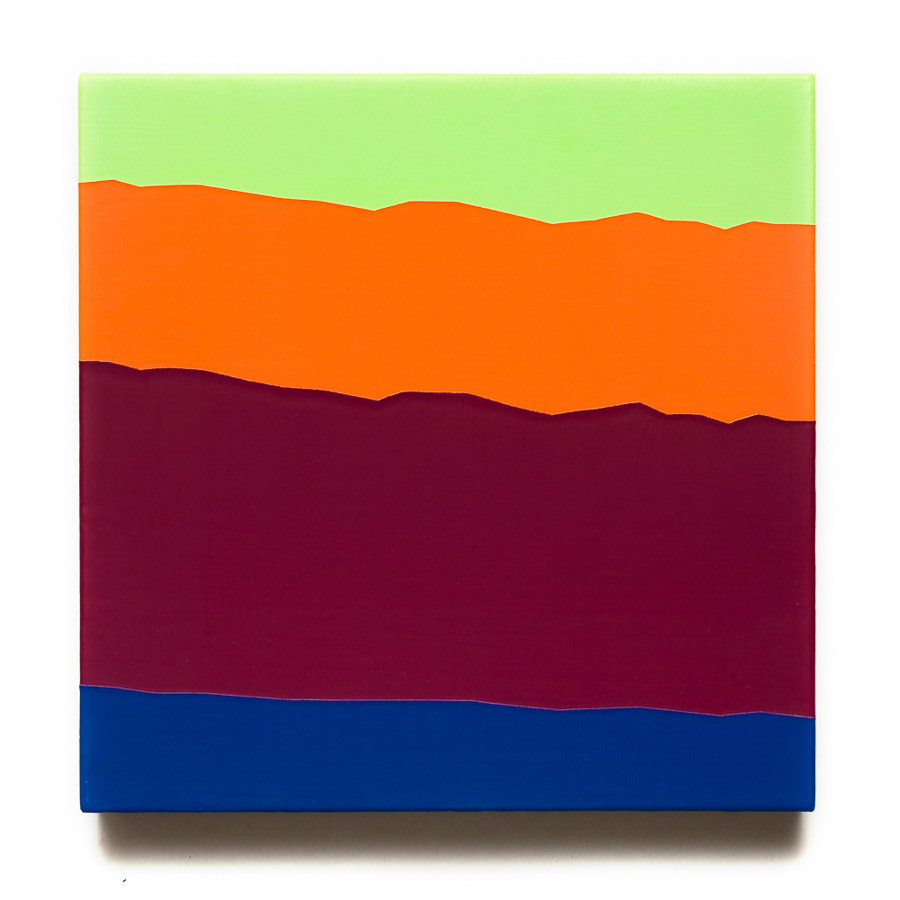
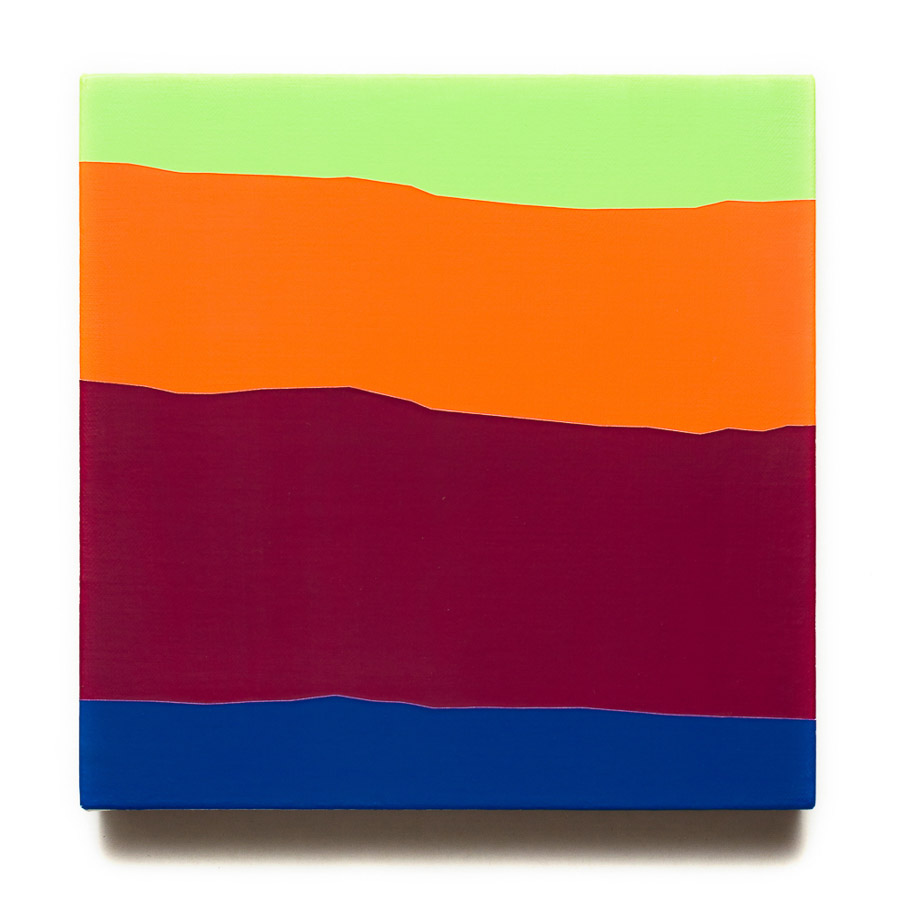
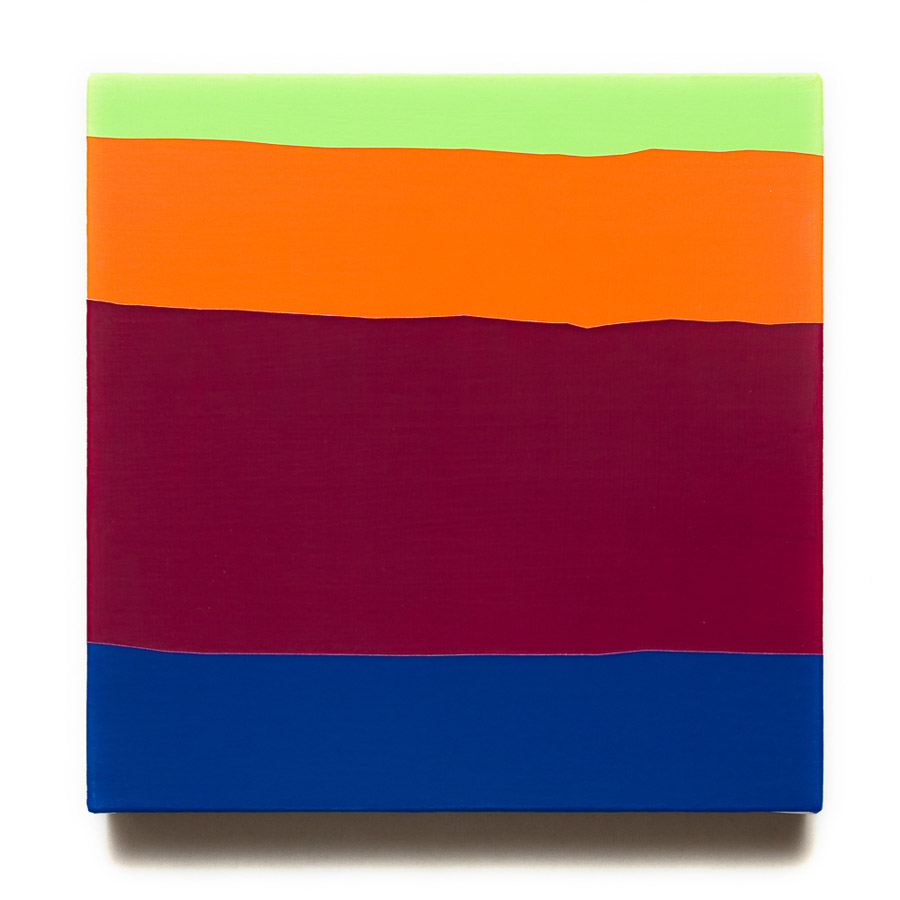
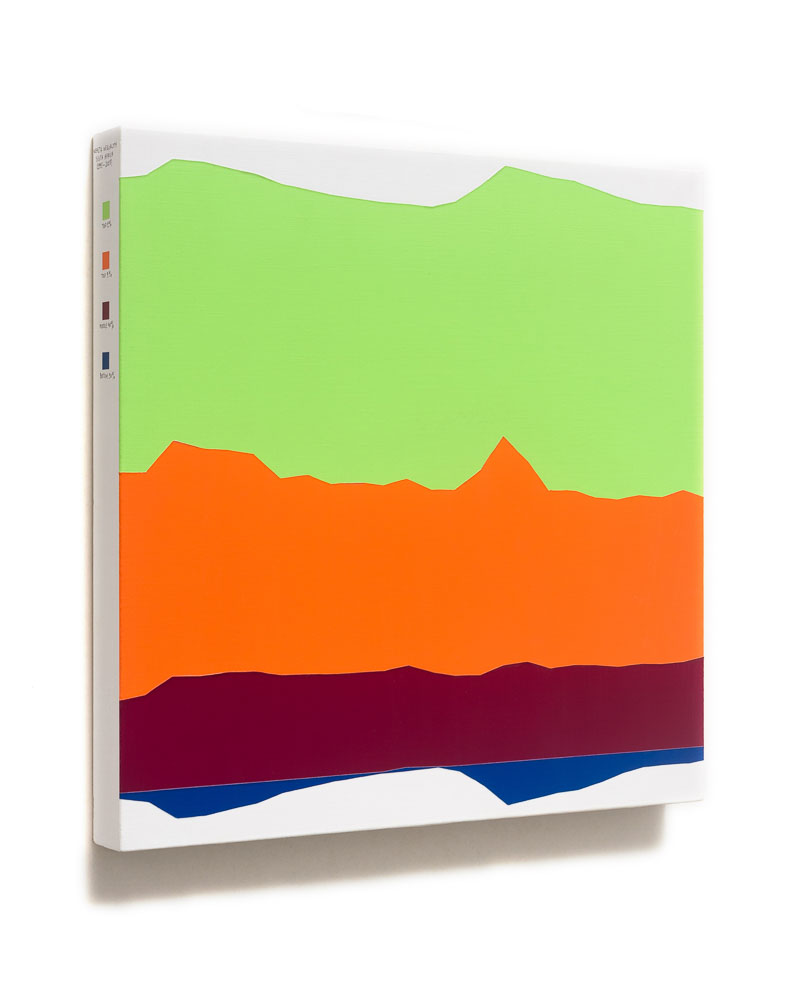
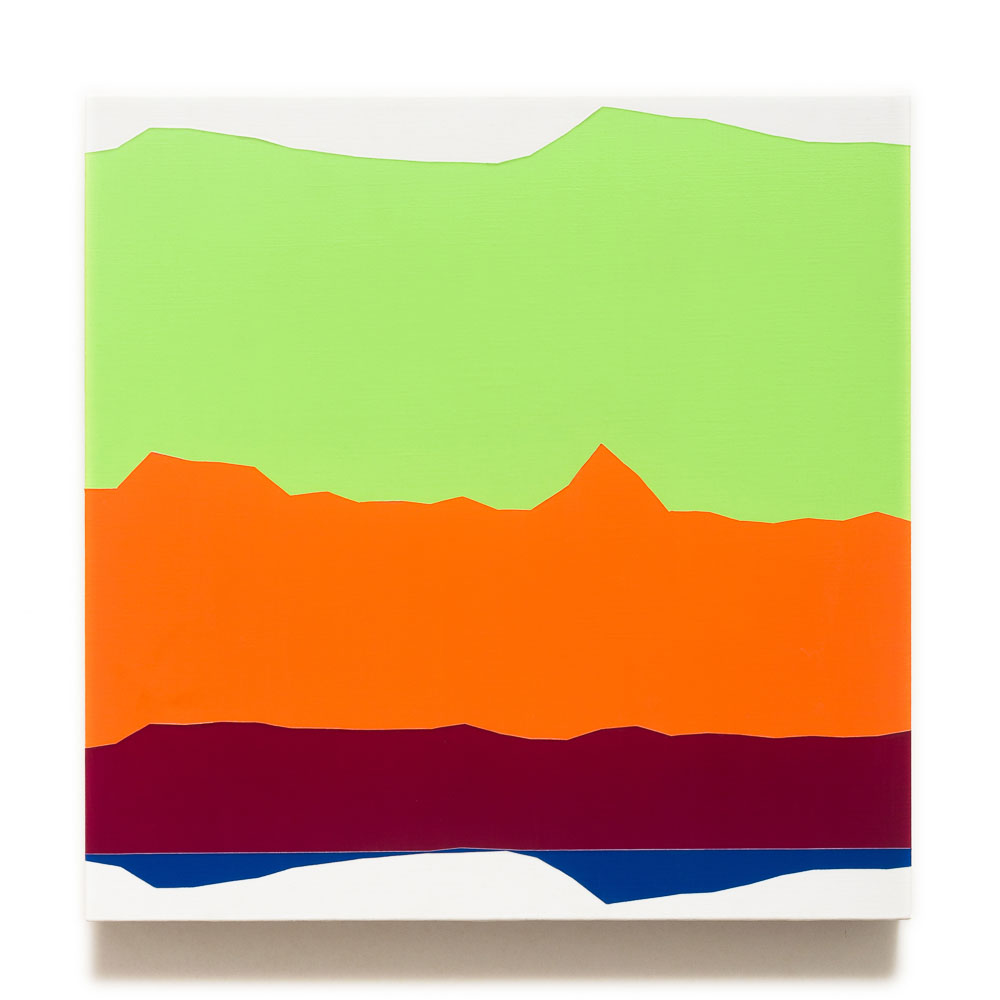
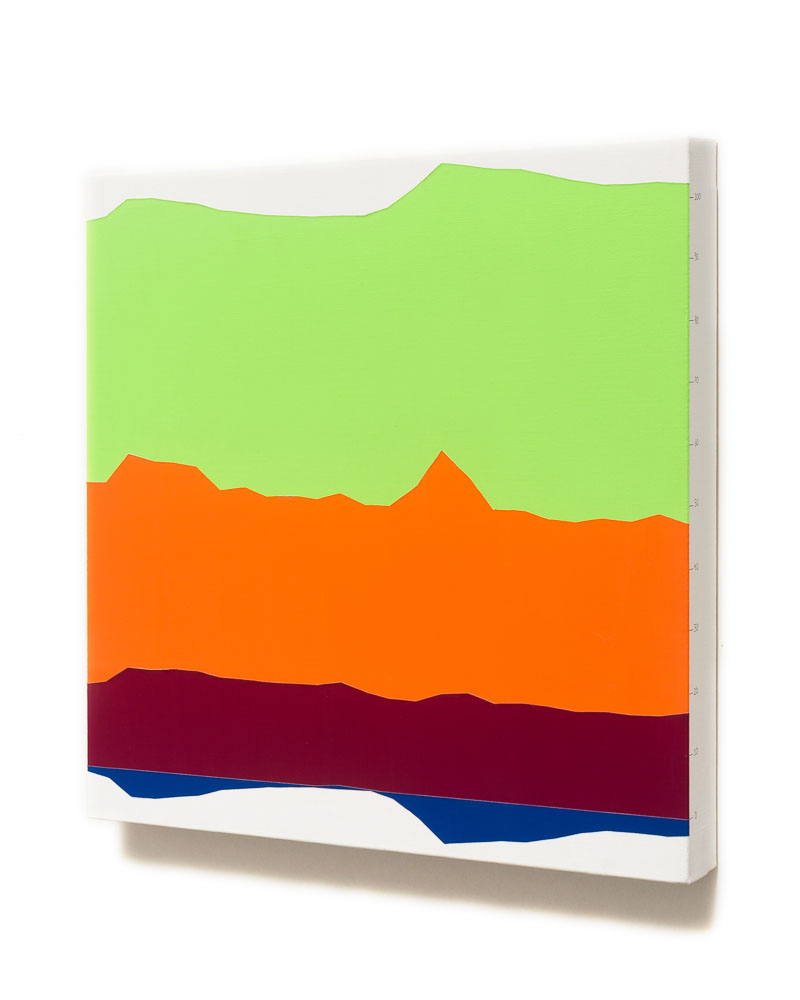
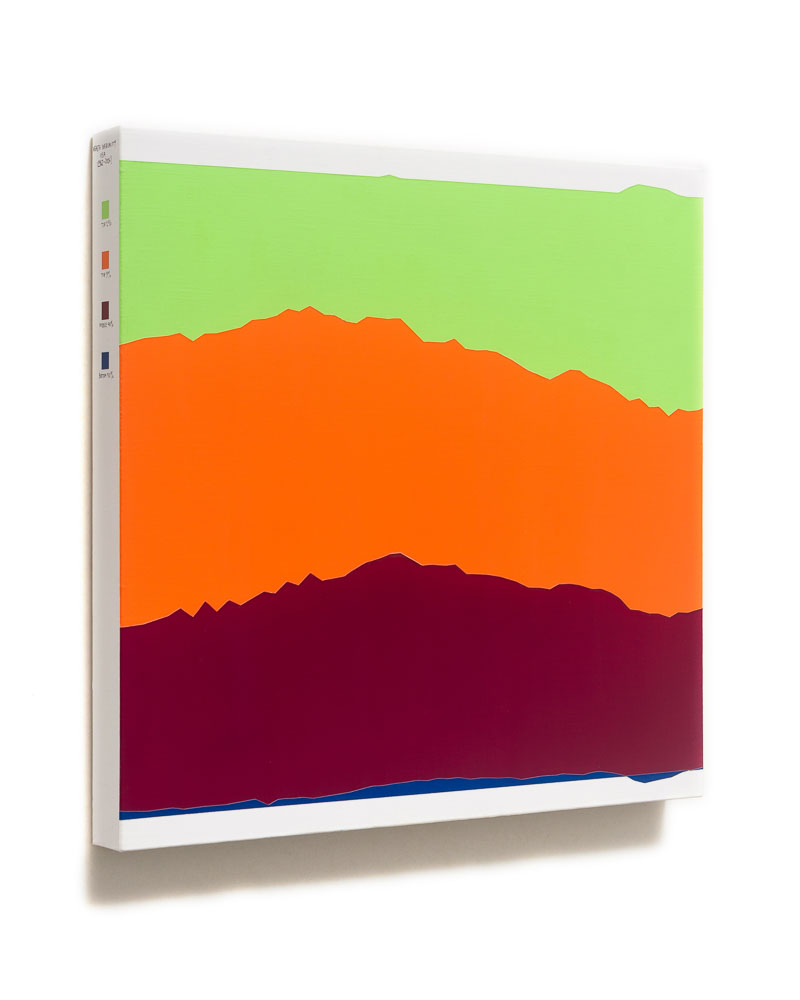
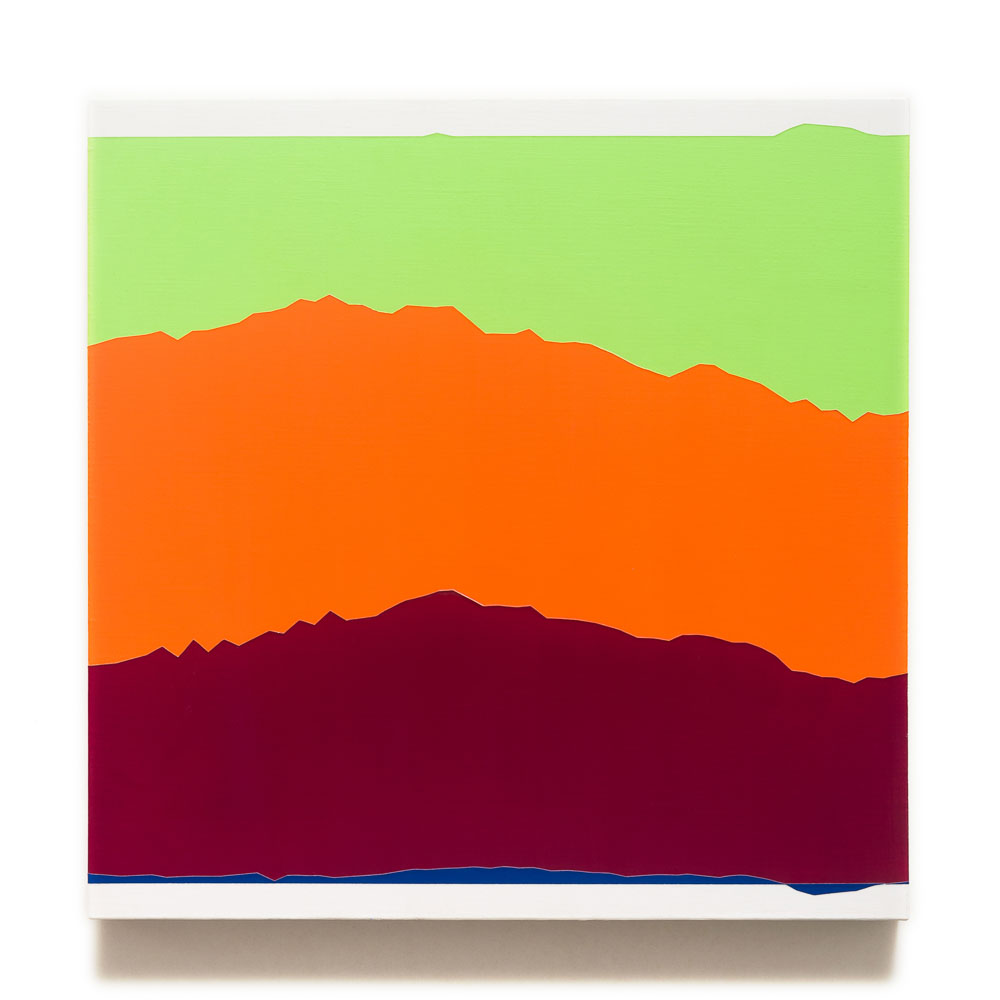
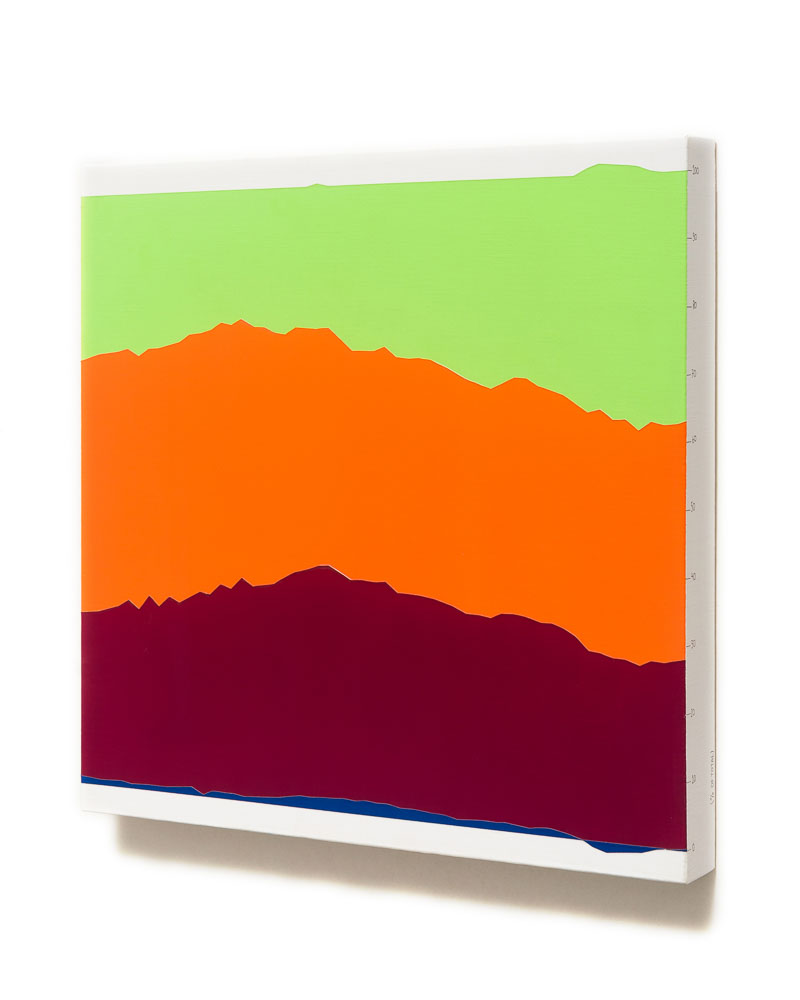
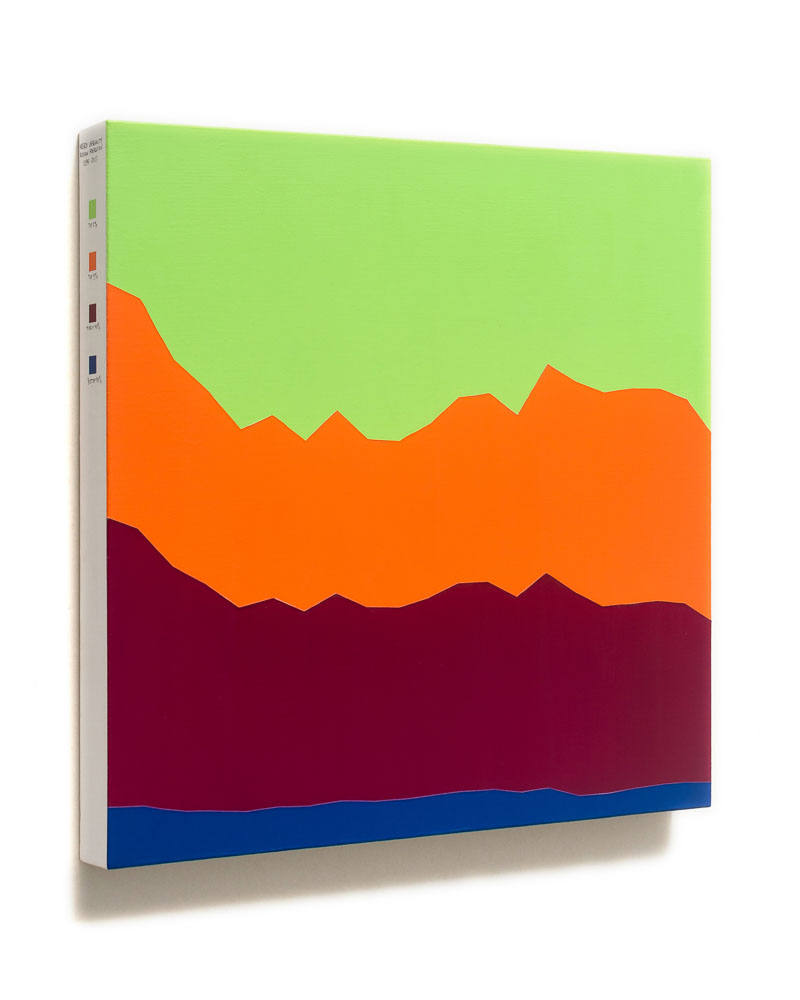
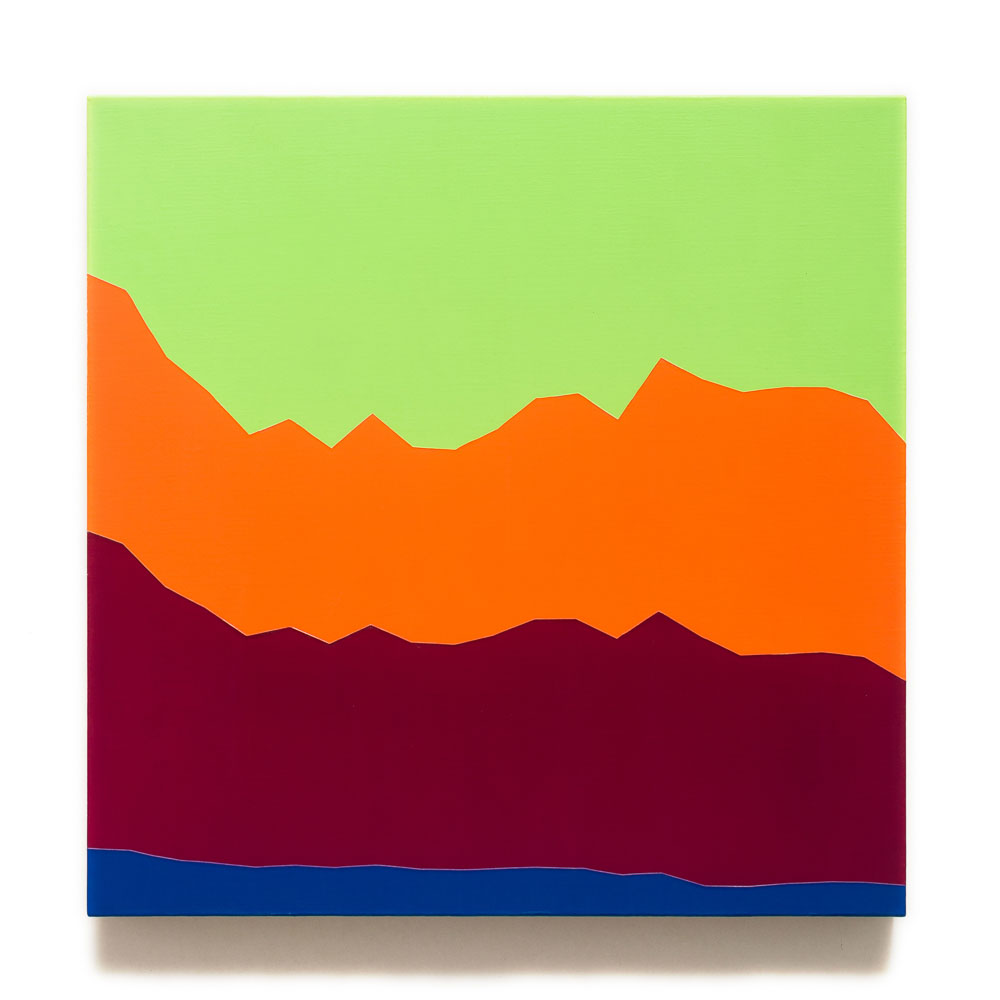
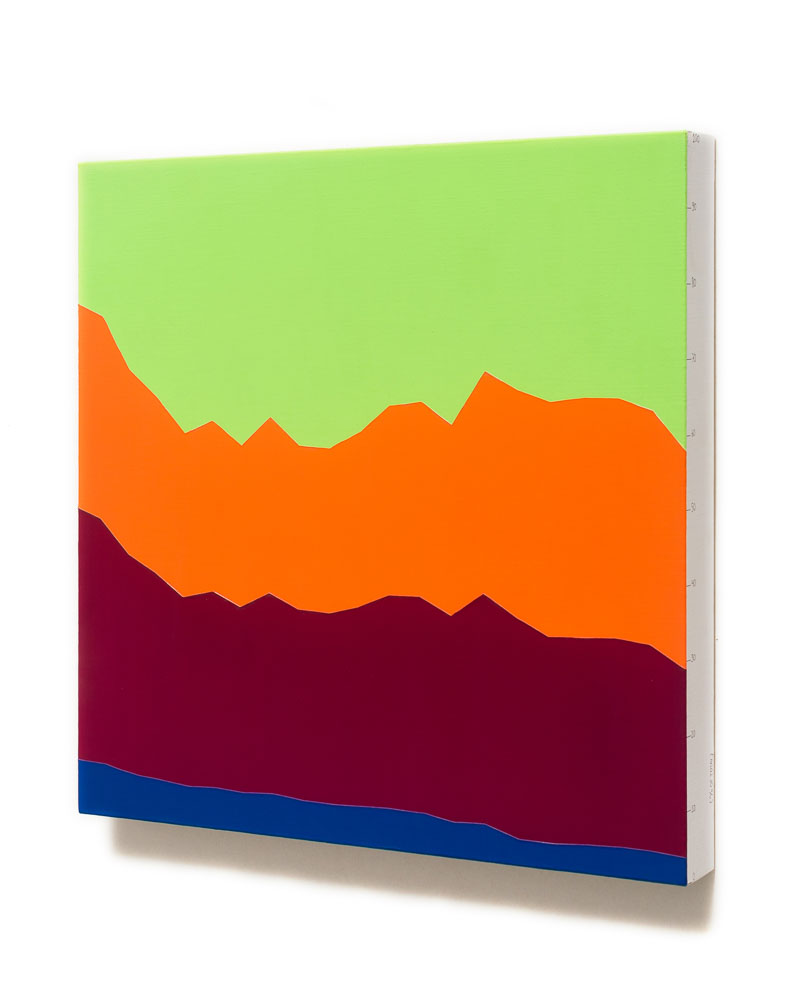
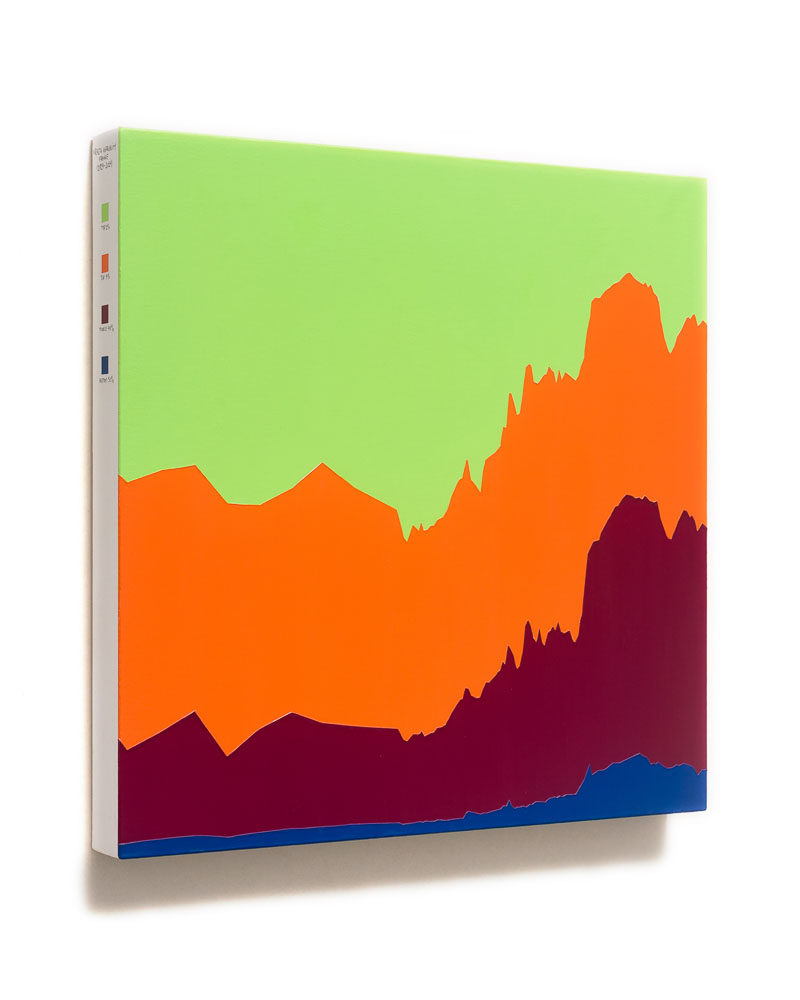
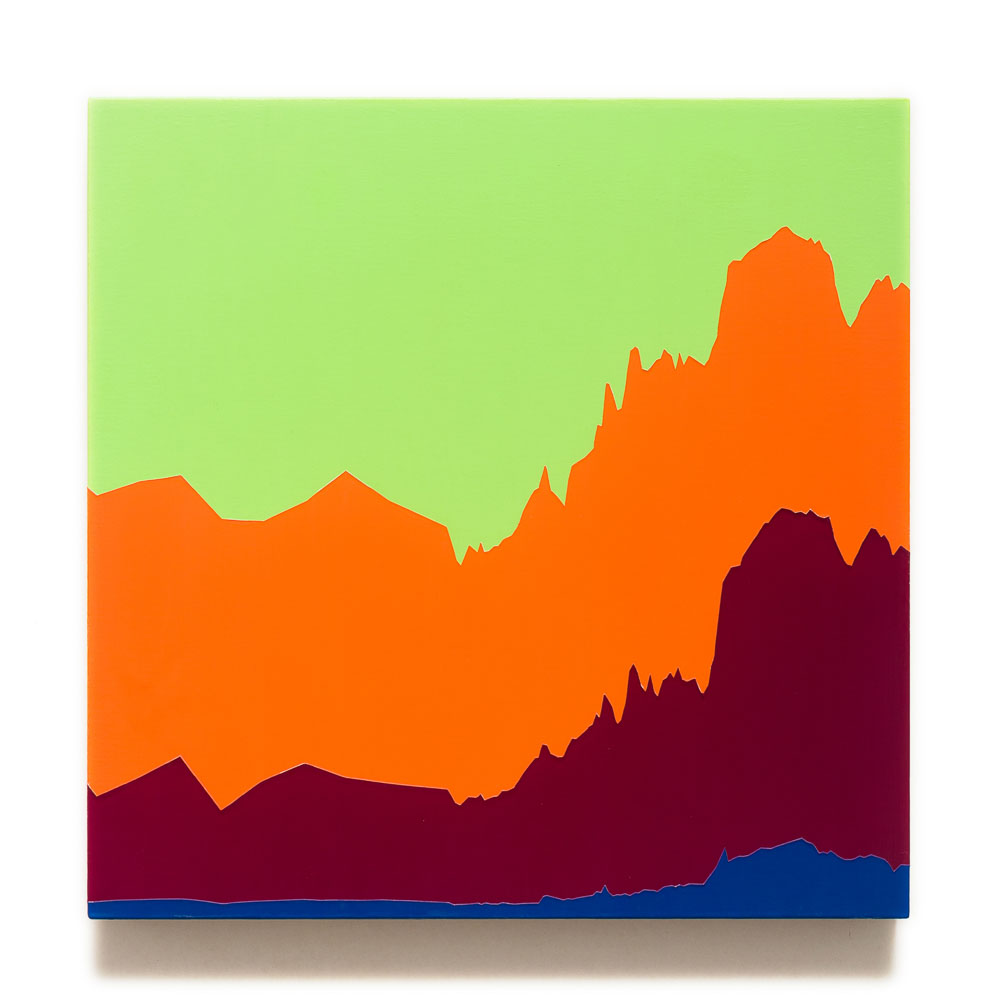
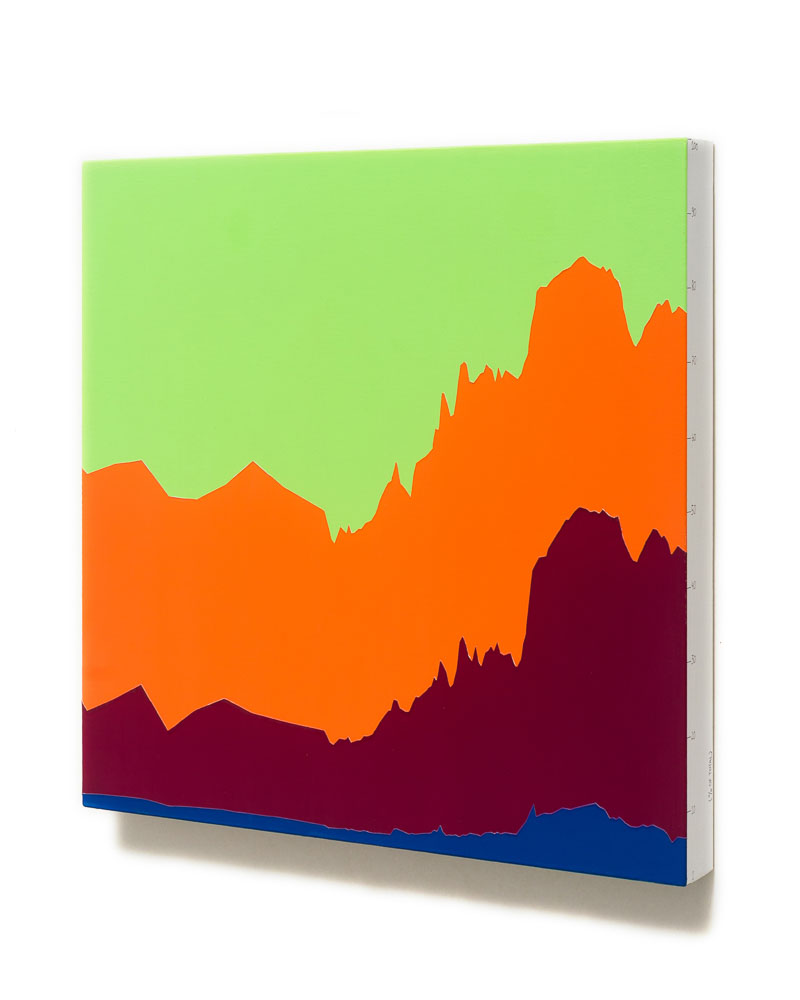
The set Untitled #8 to #16 was built with data from the research on pre-tax income inequality (Alvaredo/ Piketty), available in the World Inequality Database. Separated into 8 macro-regions of the world, the compositions present income shares concentrated by the richest 1%, the next 9%, the middle 40% and the bottom 50%. The ninth composition groups all available data, revealing an average of the values between the years 1990 to 2015.
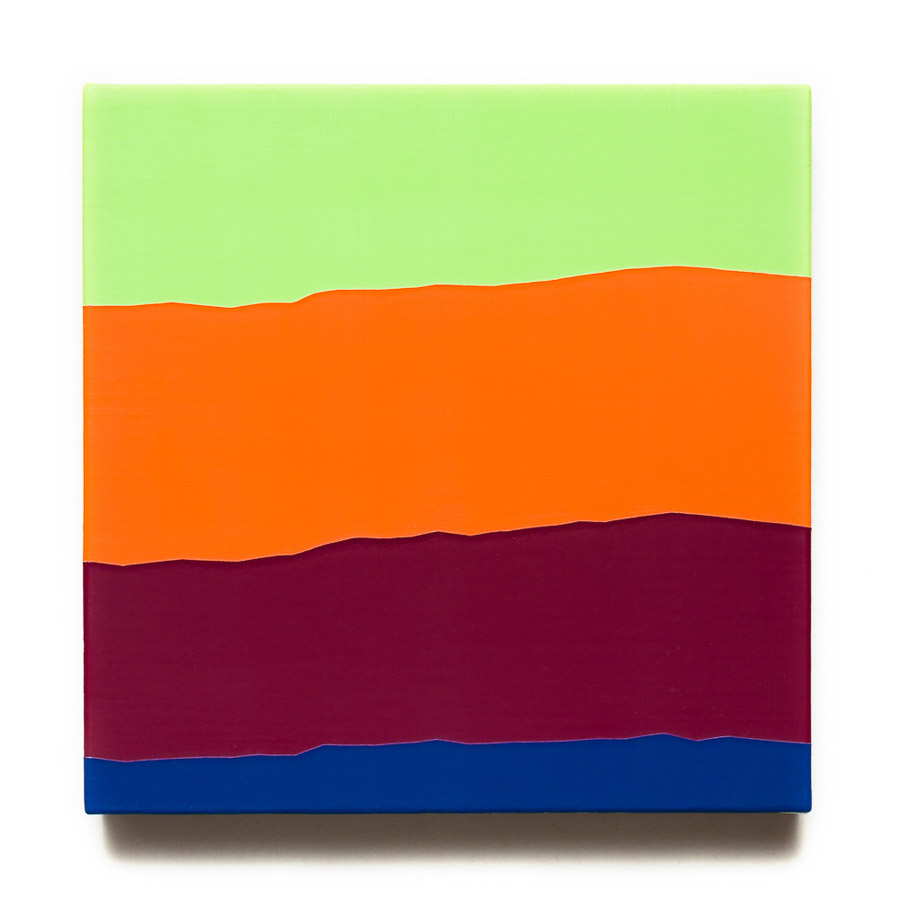
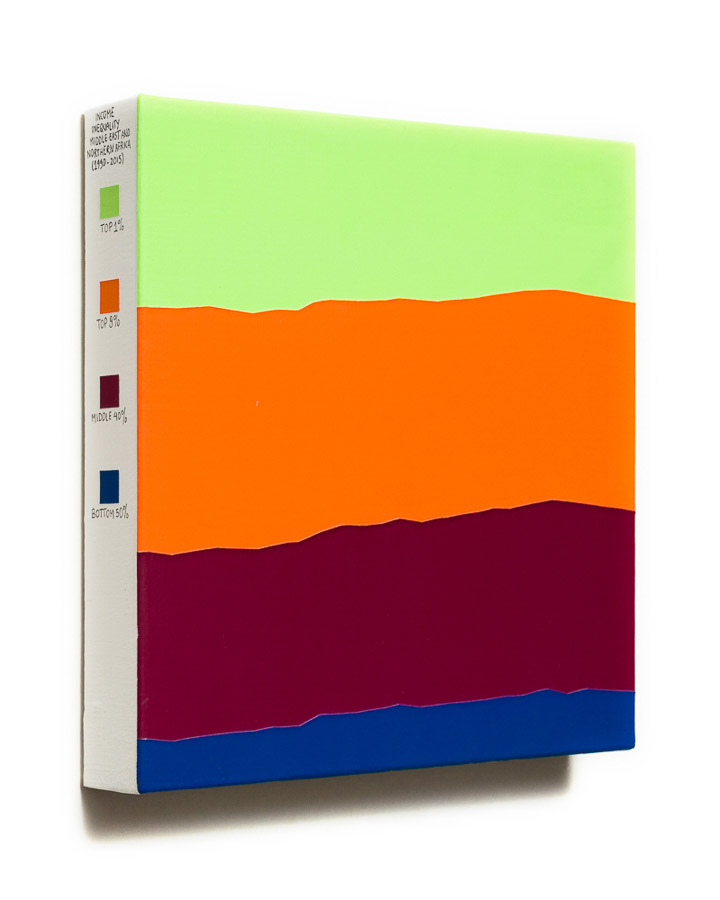
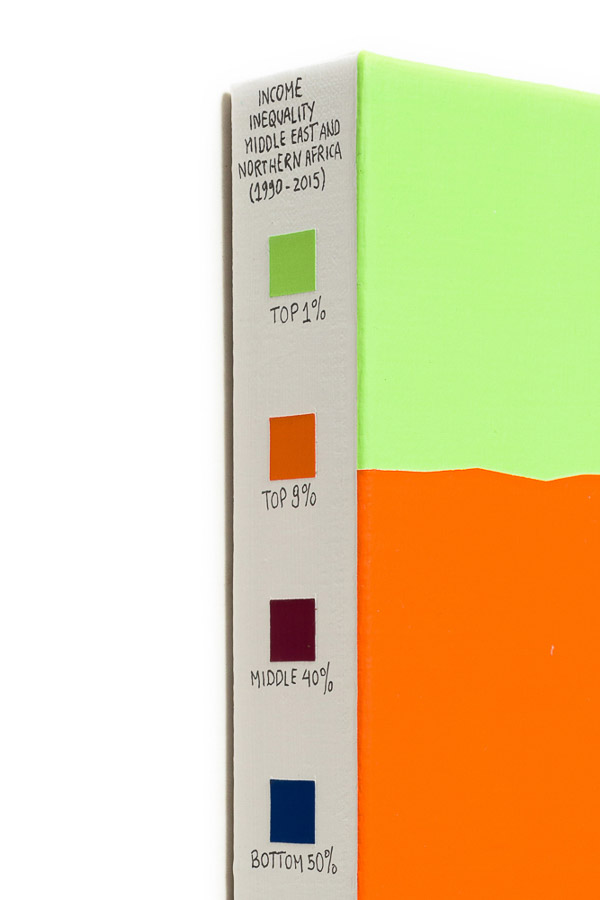
Untitled #8 (Pre-tax income inequality, Middle East and Northern Africa, 1990-2015)
acrylics, ink marker and varnish on canvas
20×20 cm
2020

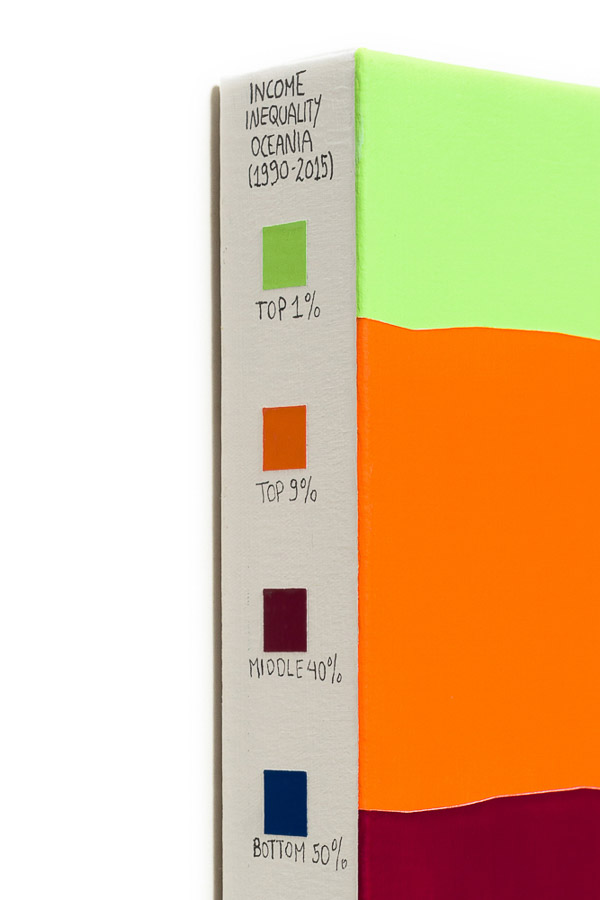
Untitled #9 (Pre-tax income inequality, Oceania, 1990-2015)
acrylics, ink marker and varnish on canvas
20×20 cm
2020
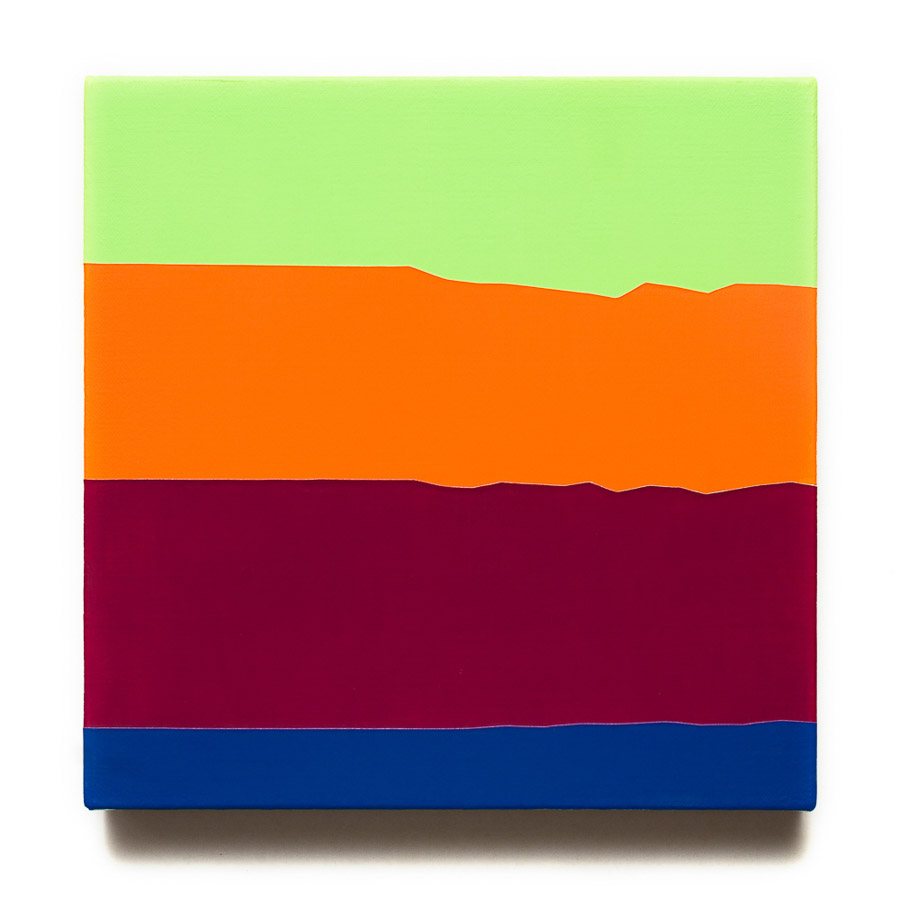
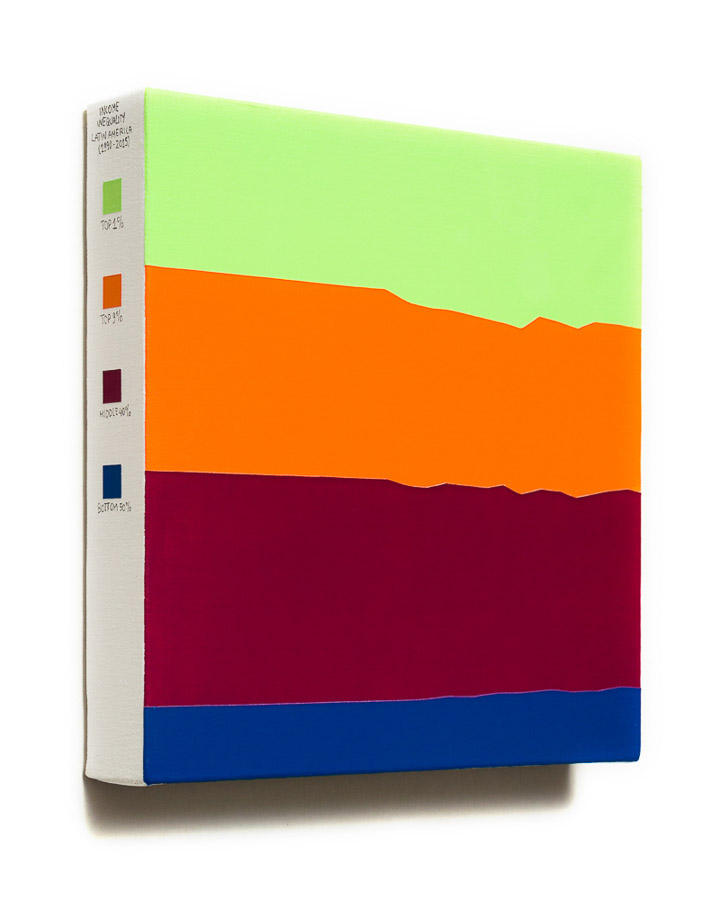
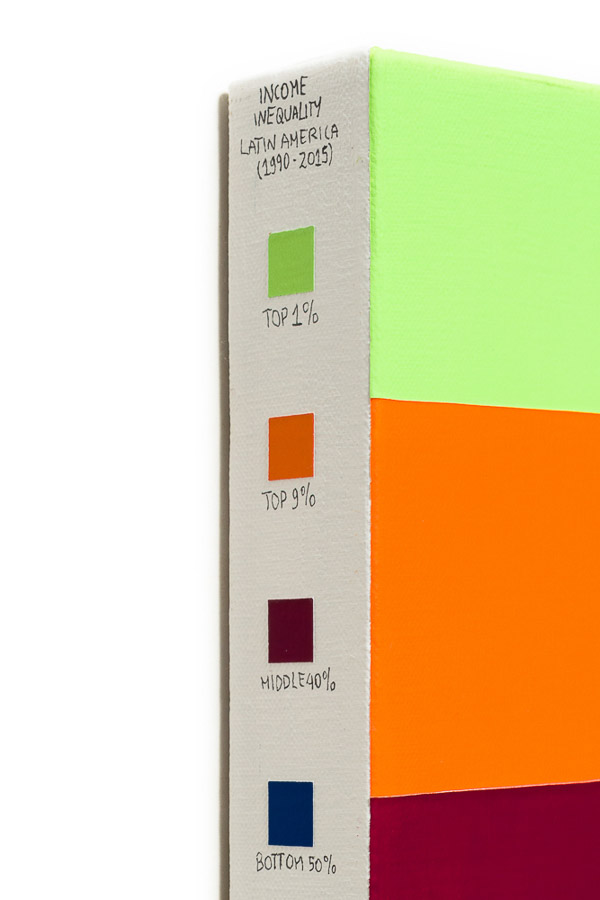
Untitled #10 (Pre-tax income inequality, Latin America, 1990-2015)
acrylics, ink marker and varnish on canvas
20×20 cm
2020
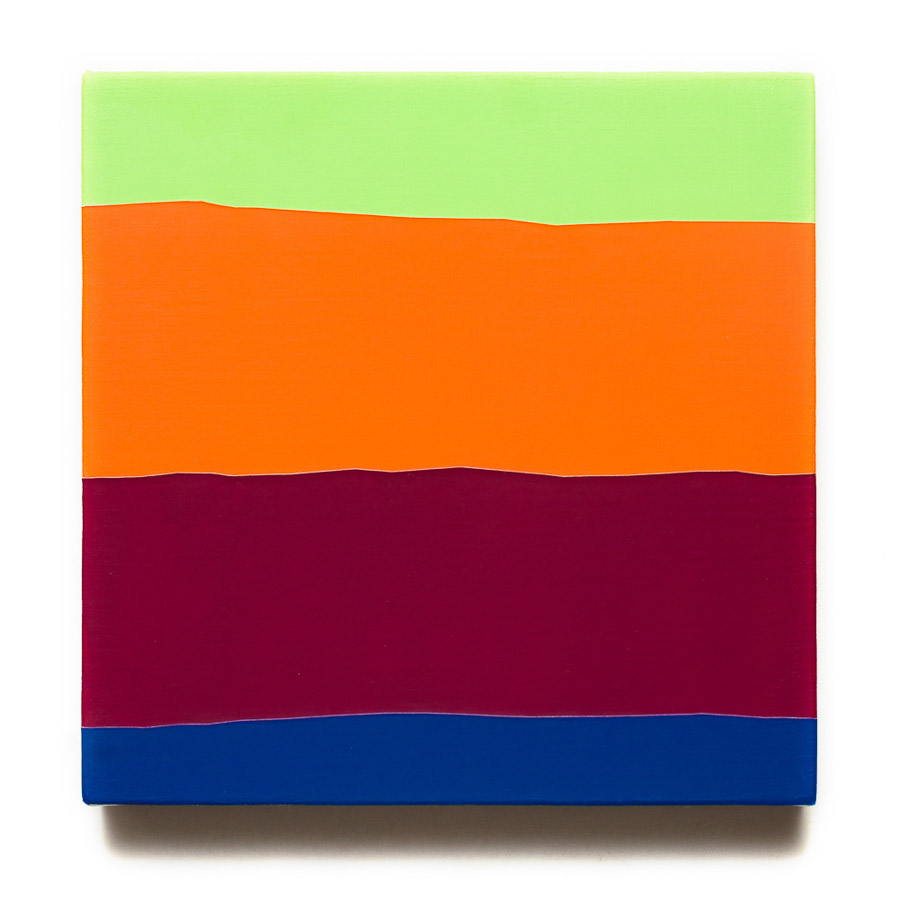
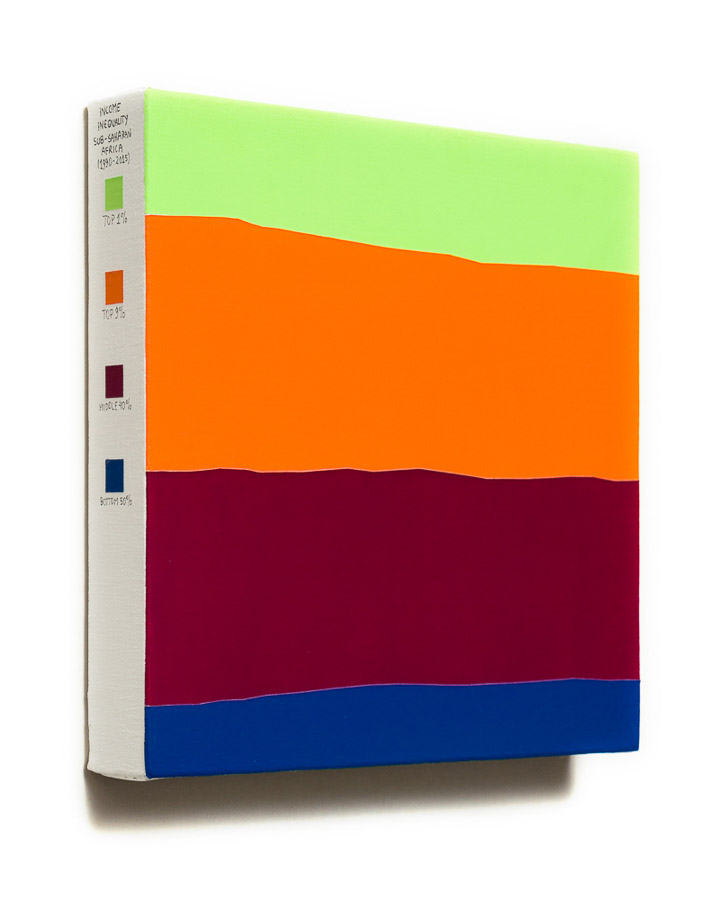
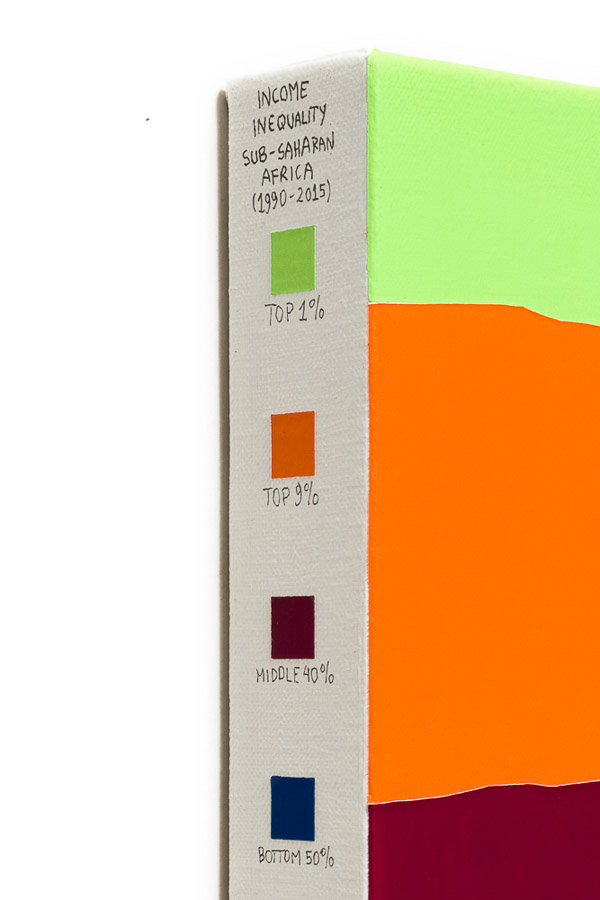
Untitled #11 (Pre-tax income inequality, Sub-Saharan Africa, 1990-2015)
acrylics, ink marker and varnish on canvas
20×20 cm
2020
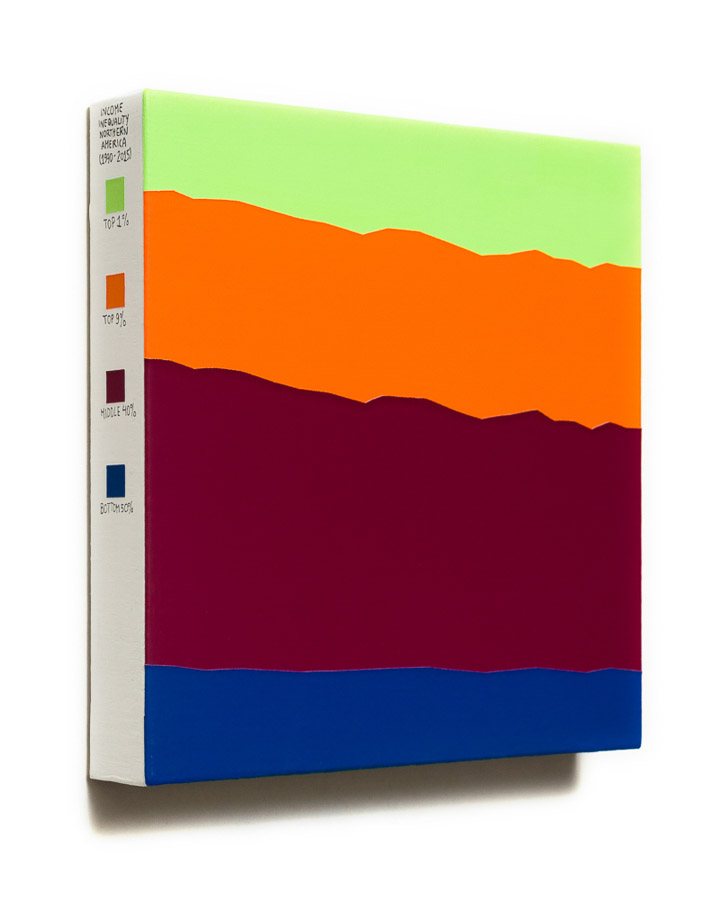

Untitled #12 (Pre-tax income inequality, Northern America, 1990-2015)
acrylics, ink marker and varnish on canvas
20×20 cm
2020
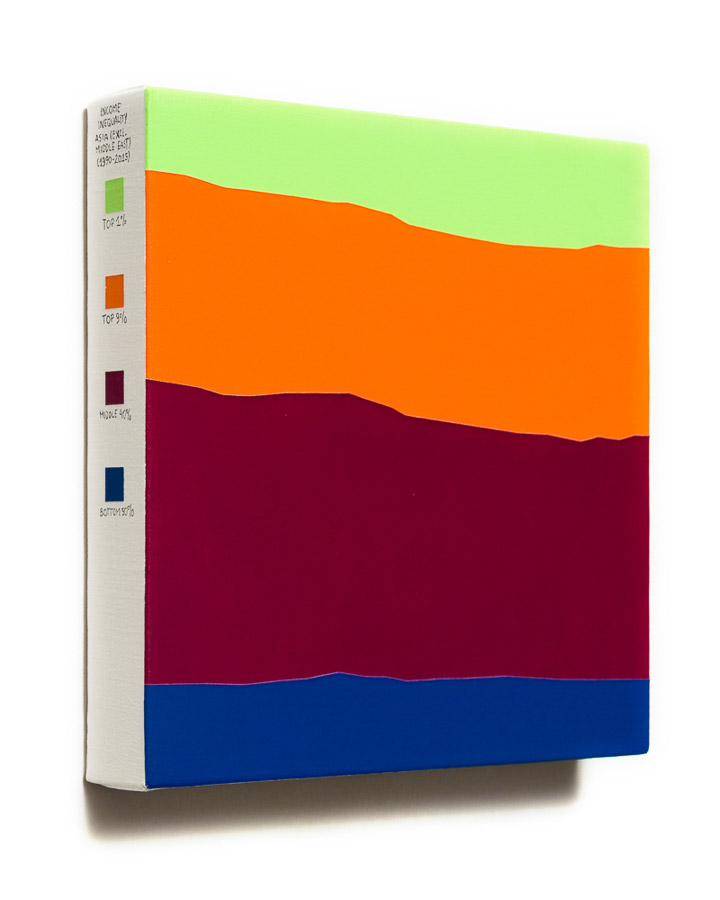
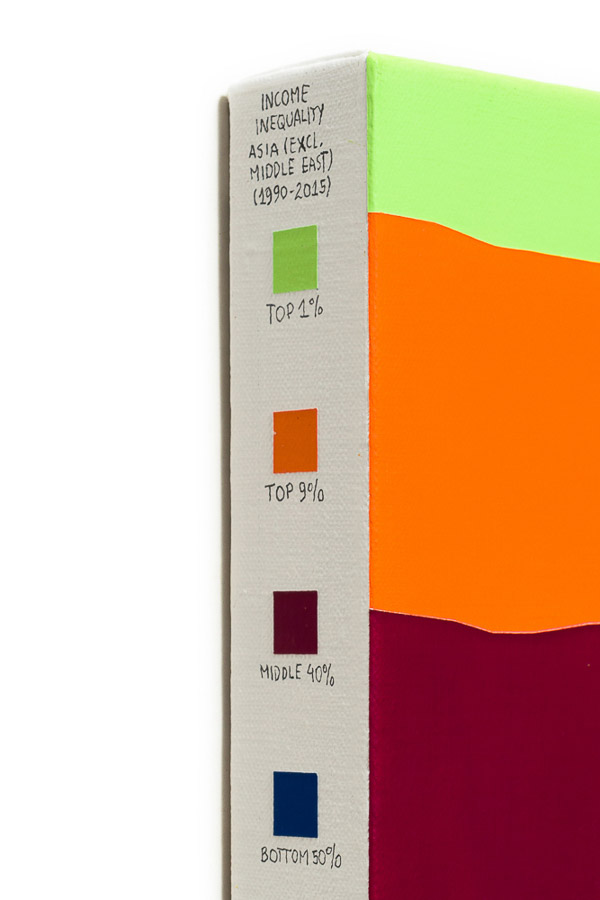
Untitled #13 (Pre-tax income inequality, Asia (excluding Middle East), 1990-2015)
acrylics, ink marker and varnish on canvas
20×20 cm
2020
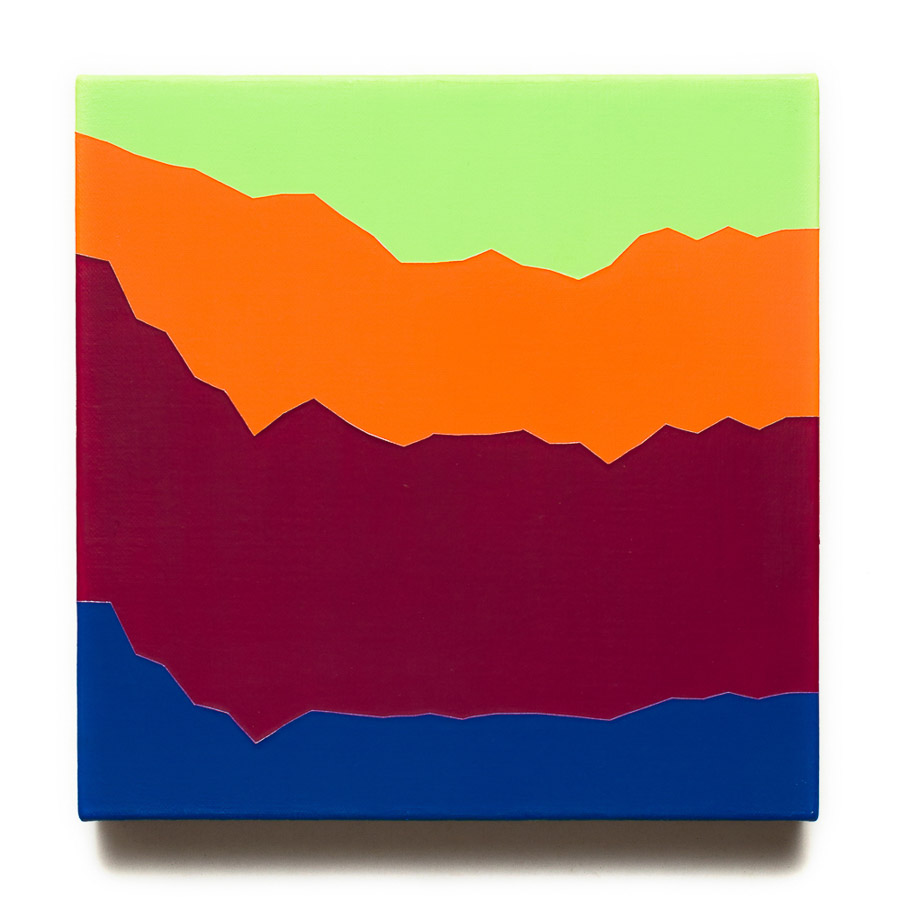
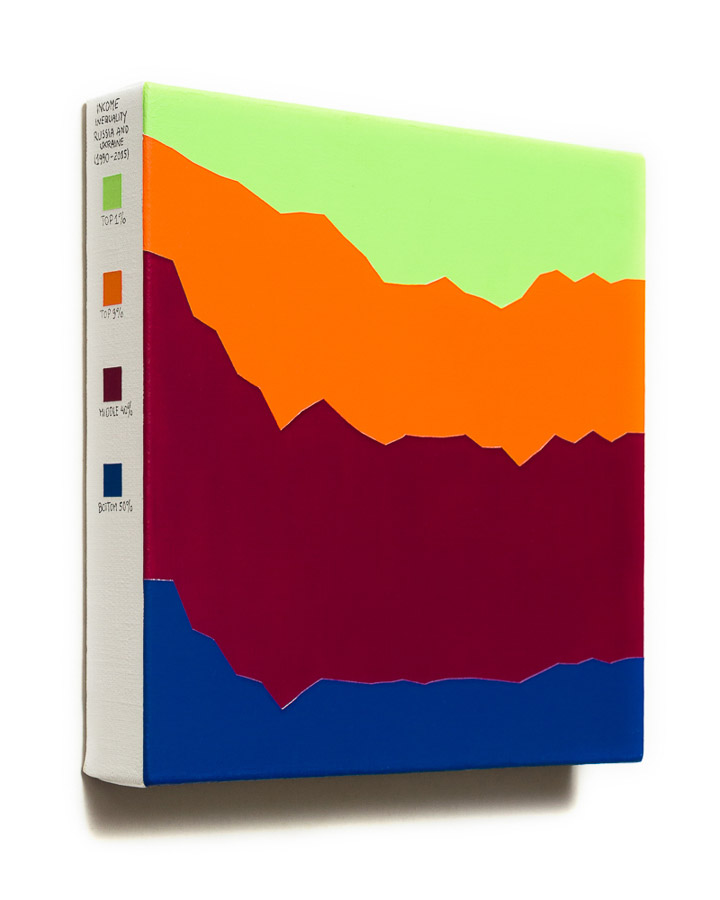
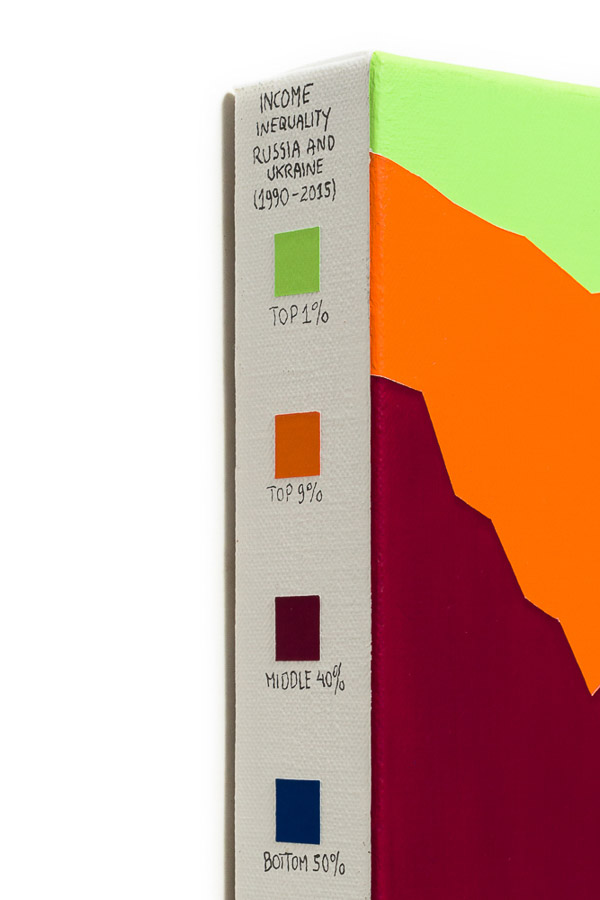
Untitled #14 (Pre-tax income inequality, Russia and Ukraine, 1990-2015)
acrylics, ink marker and varnish on canvas
20×20 cm
2020
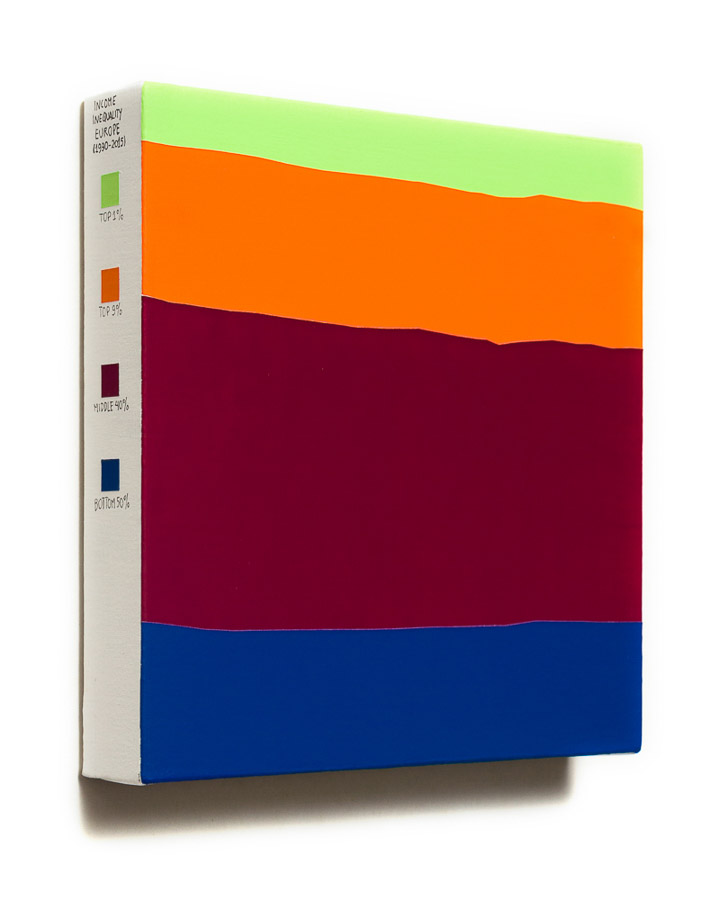
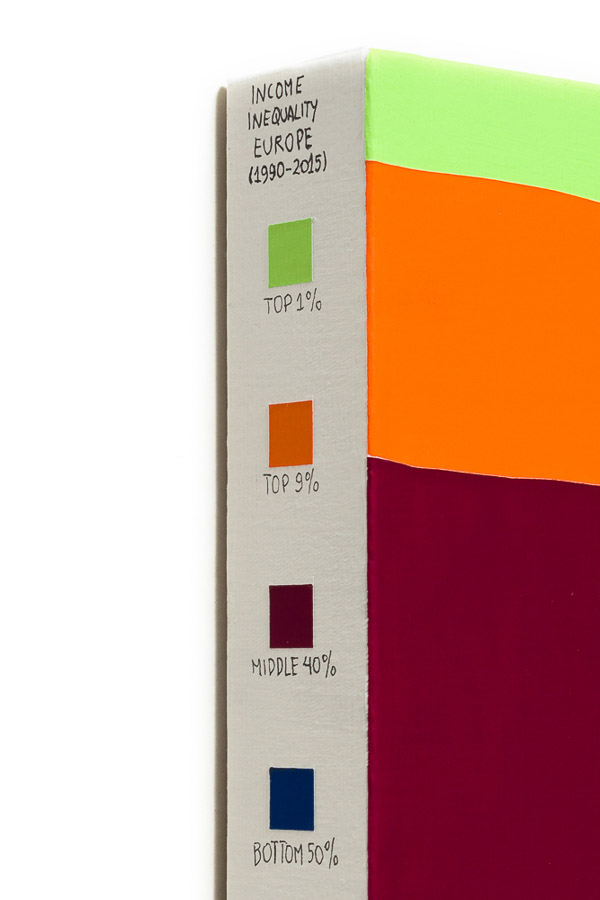
Untitled #15 (Pre-tax income inequality, Europe, 1990-2015)
acrylics, ink marker and varnish on canvas
20×20 cm
2020
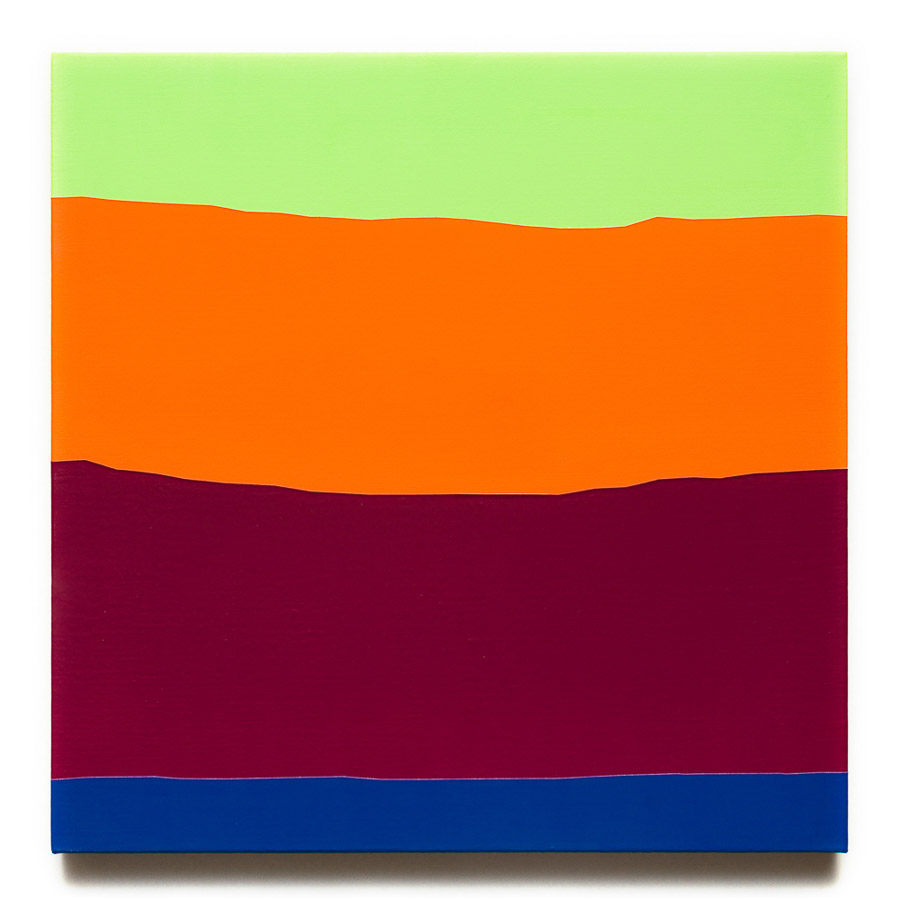

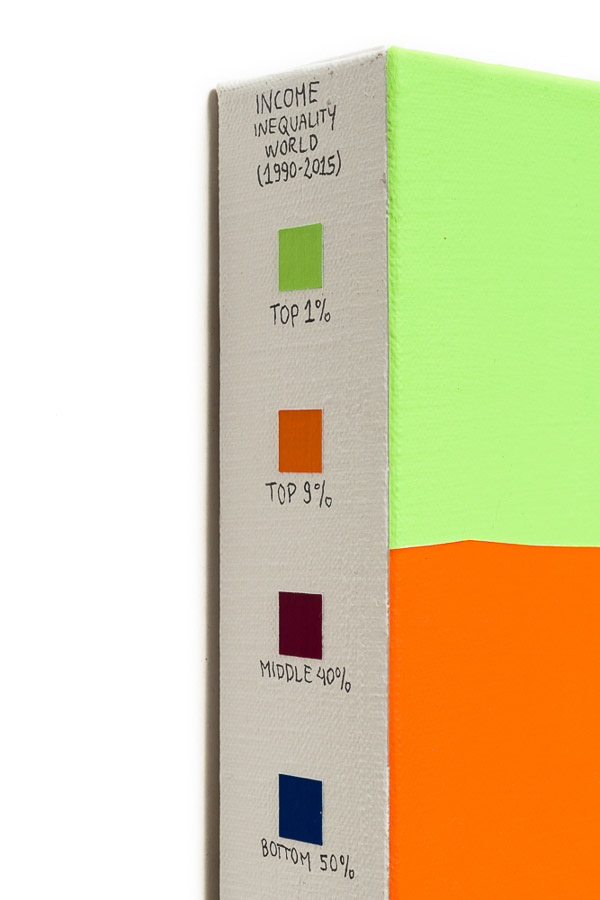
Untitled #16 (Pre-tax income inequality, World, 1990-2015)
acrylics, ink marker and varnish on canvas
40×40 cm
2020
The set from Untitled #17 to #21 was also created using data from the World Inequality Database, but with the descriptor of wealth inequality. There are few countries that compile data on this type of concentration into historical series. South Africa, the United States, the Russian Federation, France, and China were chosen because they provide decades of information about net economic standing (assets minus liabilities) among the richest 1%, the next 9%, the middle 40%, and the poorest 50%.
Untitled #17 (Wealth inequality, South Africa, 1993-2017)
acrylics, ink marker and varnish on canvas
40×40 cm
2020
Untitled #18 (Wealth inequality, USA, 1962-2016)
acrylics, ink marker and varnish on canvas
40×40 cm
2020
Untitled #19 (Wealth inequality, Russian Federation, 1995-2015)
acrylics, ink marker and varnish on canvas
40×40 cm
2020
Untitled #20 (Wealth inequality, France, 1814-2014)
acrylics, ink marker and varnish on canvas
40×40 cm
2020
Untitled #21 (Wealth inequality, China, 1995-2015)
acrylics, ink marker and varnish on canvas
40×40 cm
2020
The economic measures to contain the crisis resulting from the emergence of the new coronavirus created a mountain of public debt that for the first time surpassed the values recorded during the Second World War. Untitled #22 brings the magnitude of the Great Lockdown to light by compiling averages of public debt as a percentage of GDP among 25 advanced economies and 27 emerging economies from 1800 to 2021, from the IMF historical debt database.
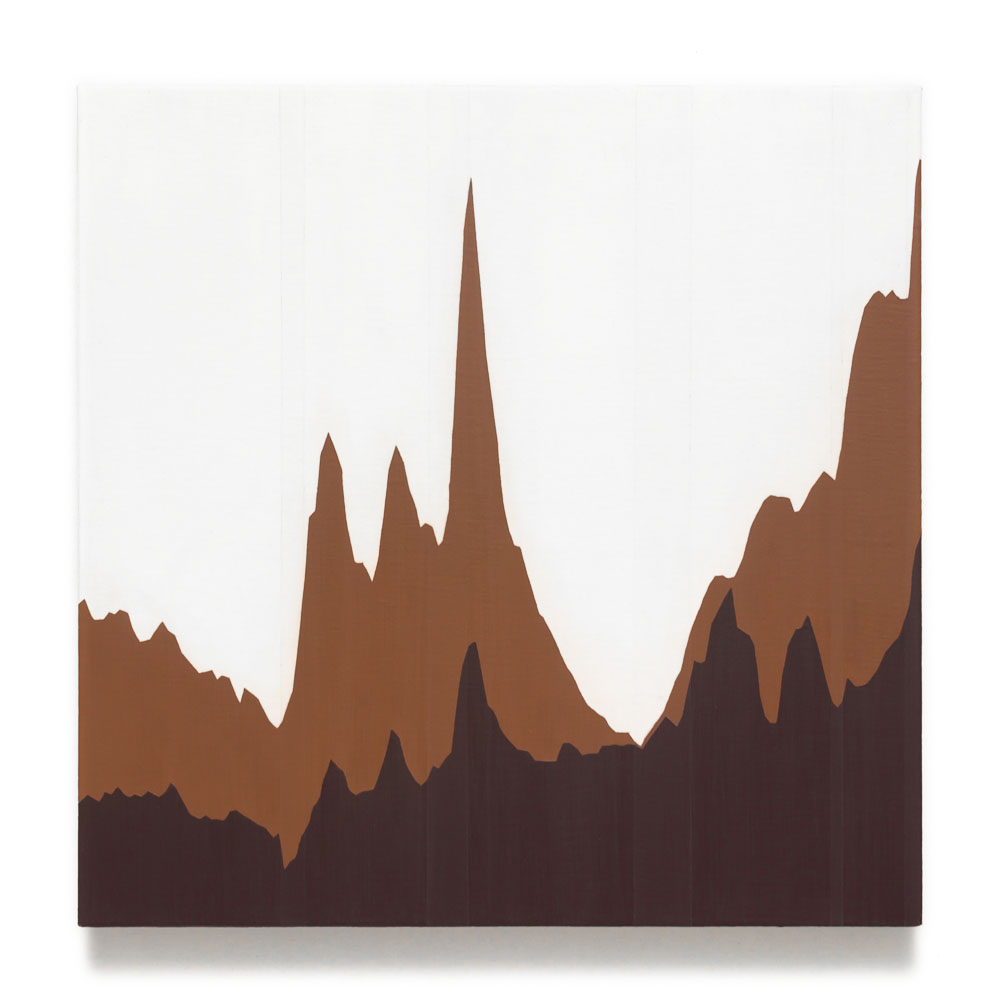
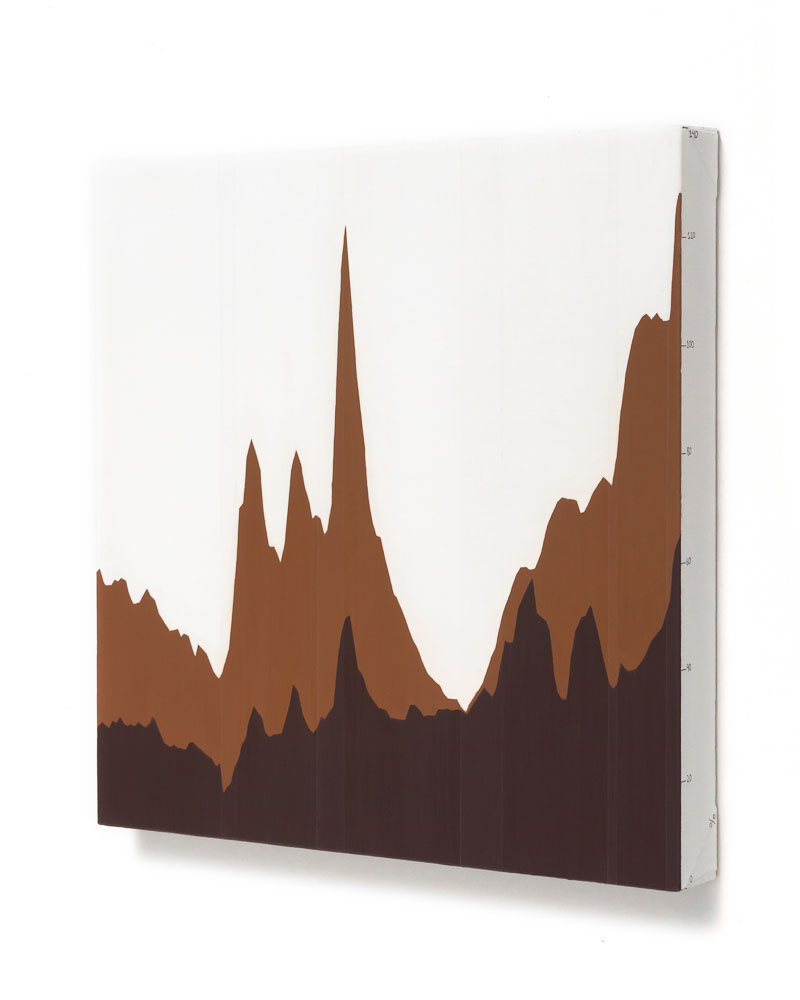
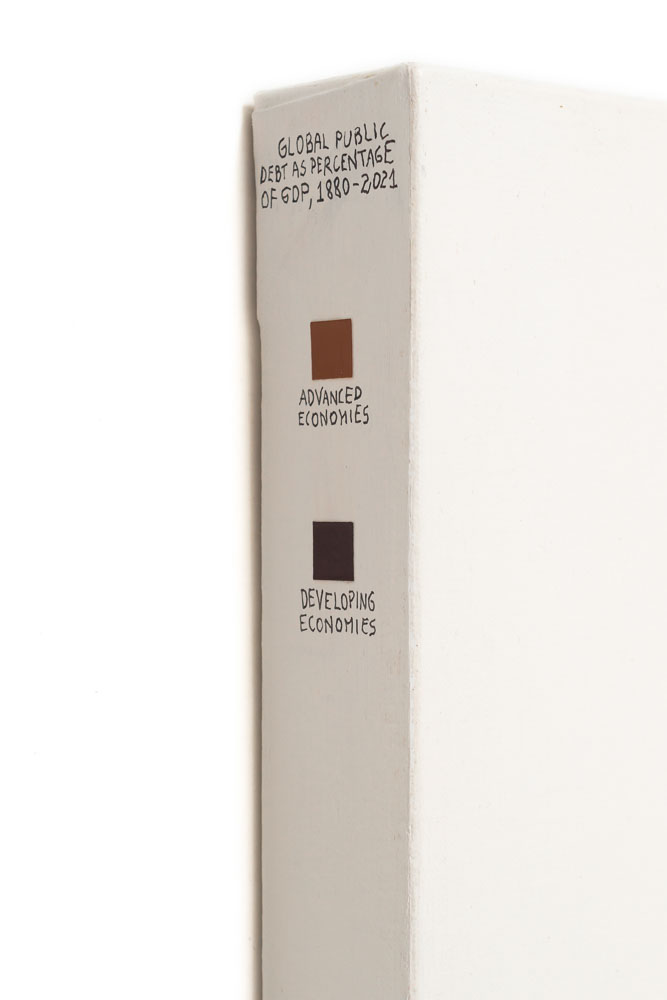
Untitled #22 (Global Public Debt as Percentage of GDP, 1880-2021)
acrylics, ink marker and varnish on canvas
40x40cm
2021
Untitled #23, #24, and #25 were created from data published by the National Confederation of Commerce.
#23 was commissioned for the exhibition The river is a snake – III Frestas Triennial of Arts, held at SESC Sorocaba, compiling an overview of family over-indebtedness, an index that recorded its highest level during the new coronavirus pandemic. #24 and #25 are more specific, showing indebtedness by income bracket and the types of debt that consume family budgets. Exhibition view by Adriano Sobral.
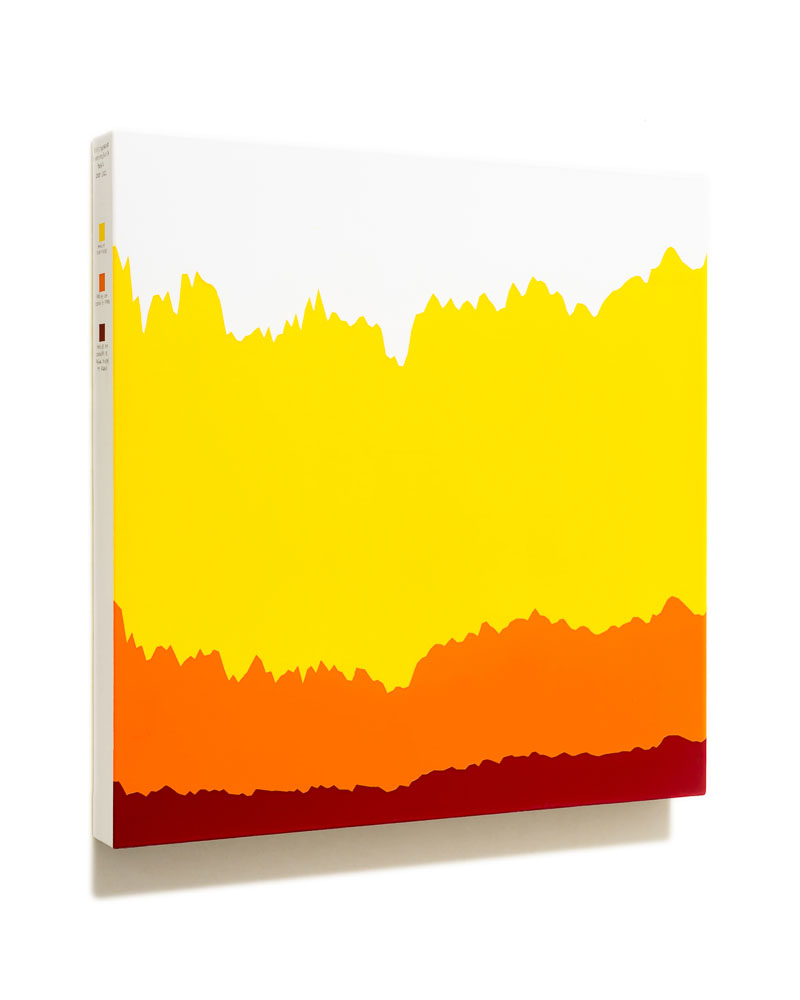
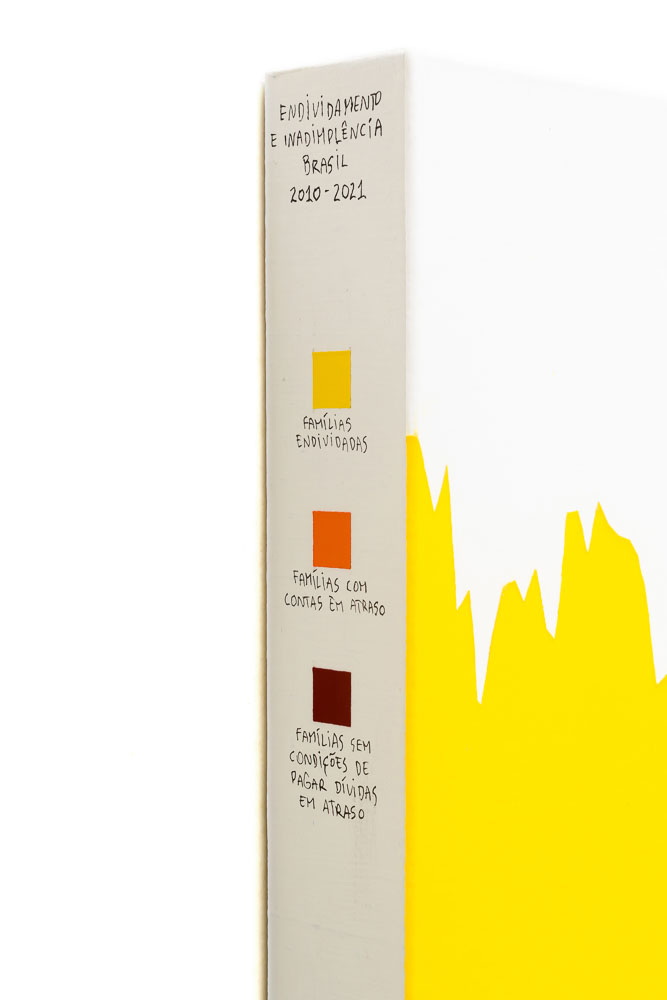
Untitled #23 (Indebtedness and default, Brazil, 2010-2021)
acrylics, ink marker and varnish on canvas
40x40cm
2021
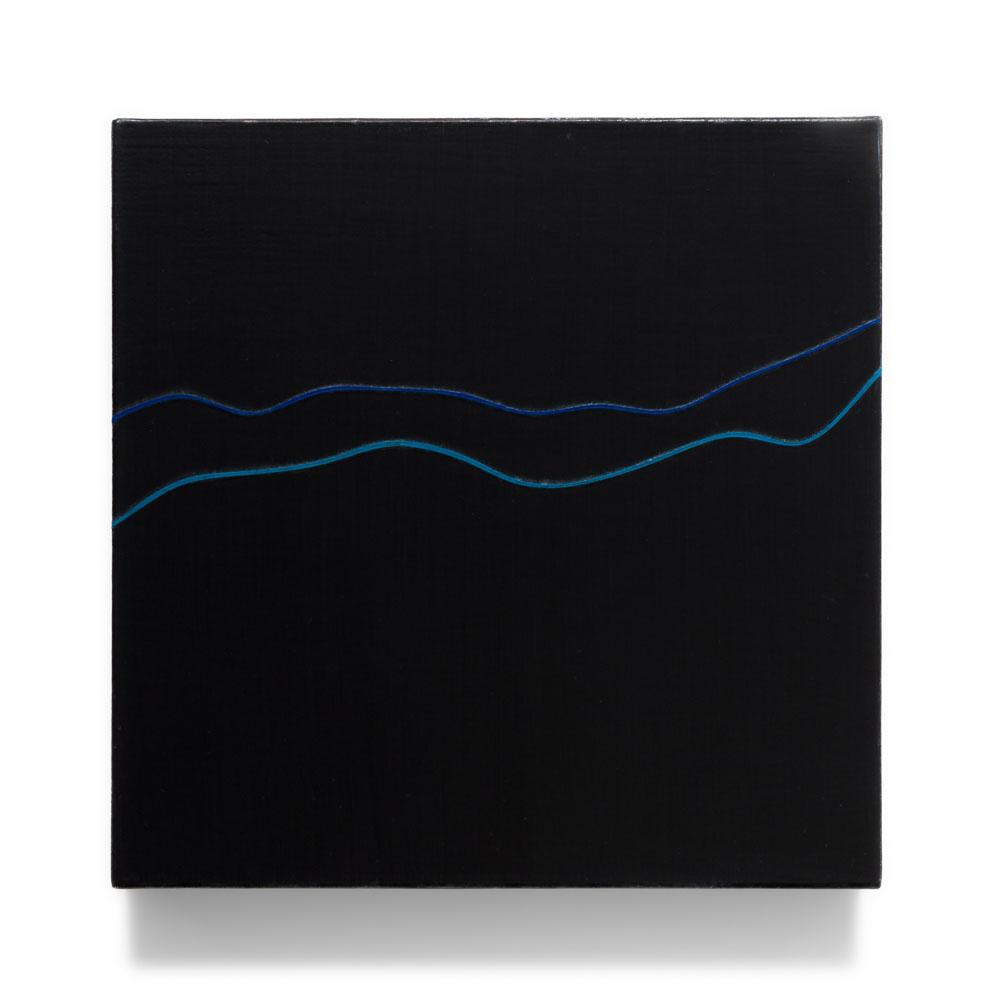
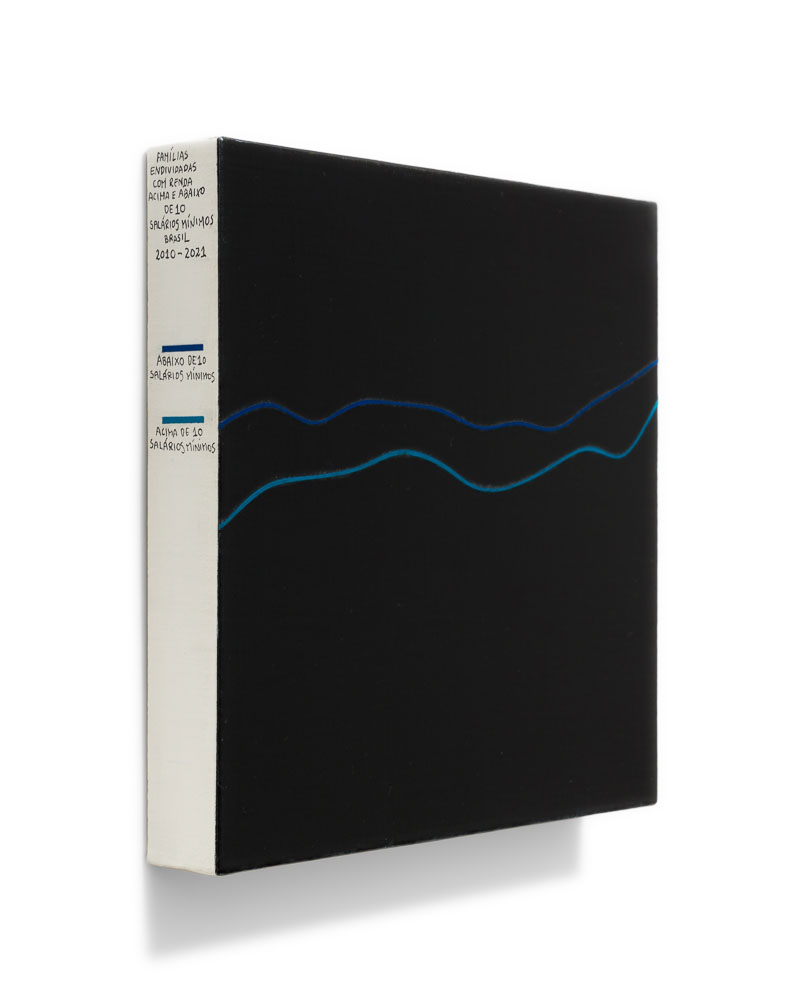
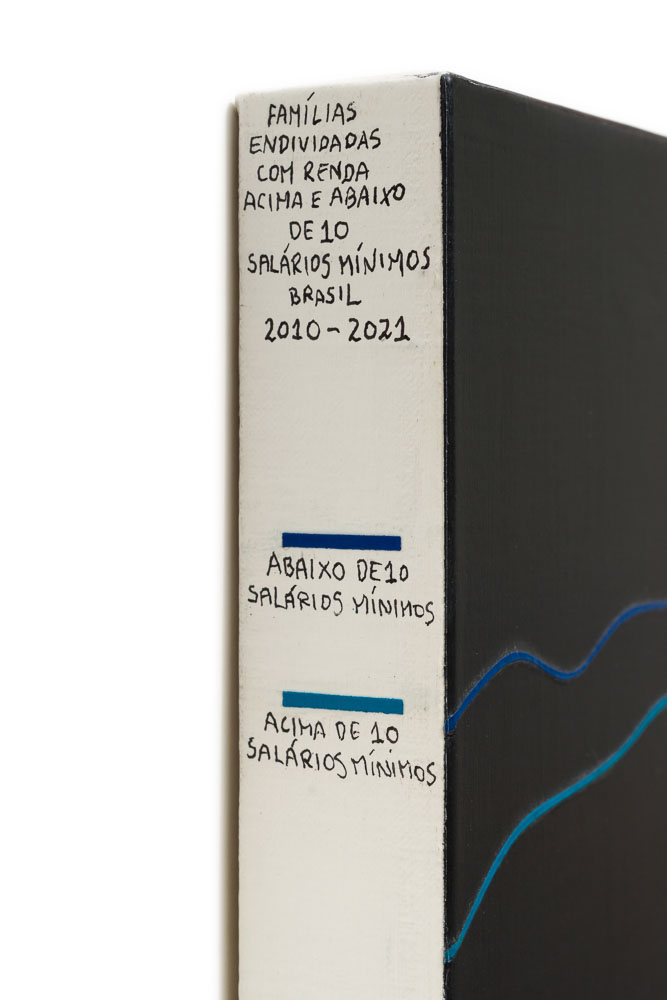
Untitled #24 (Indebted families with income above and below 10 minimum wages, Brazil, 2010-2021)
acrylics, ink marker and varnish on canvas
20x20cm
2021
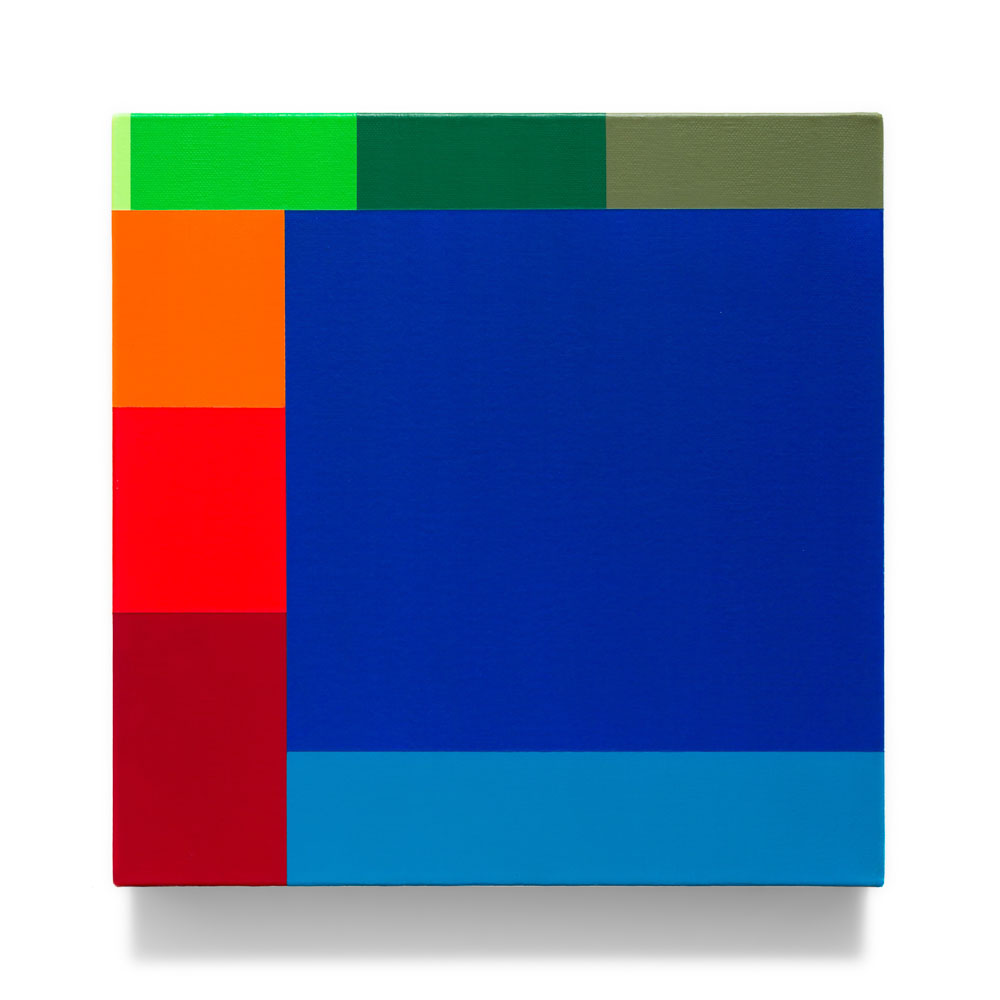
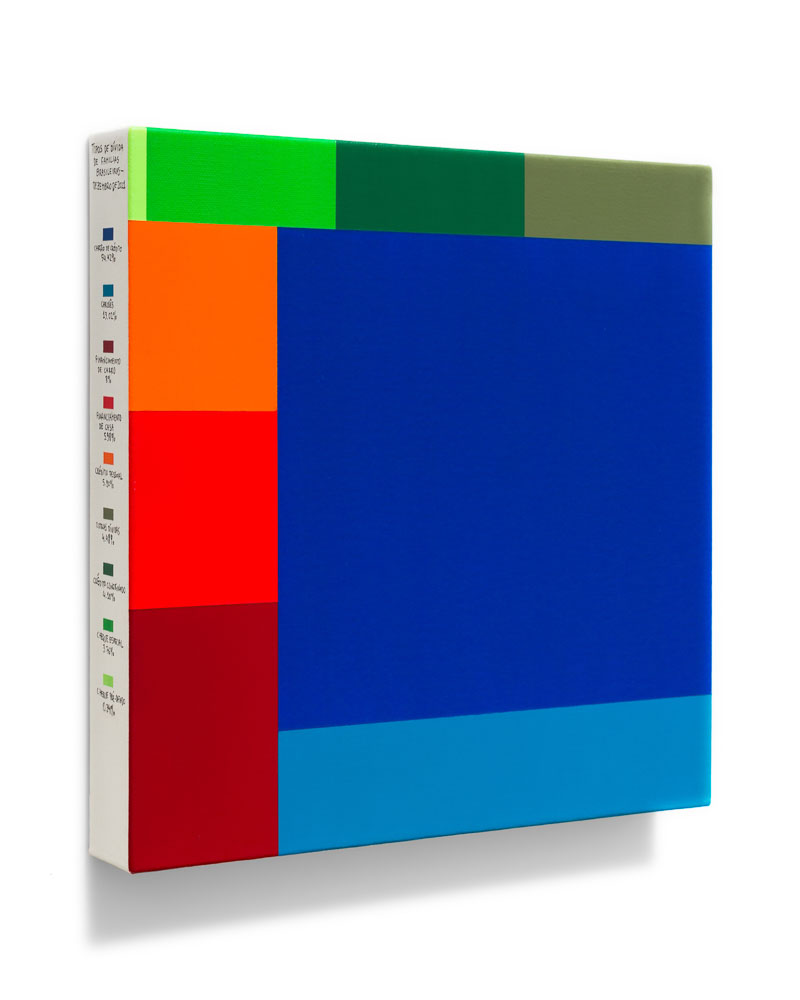
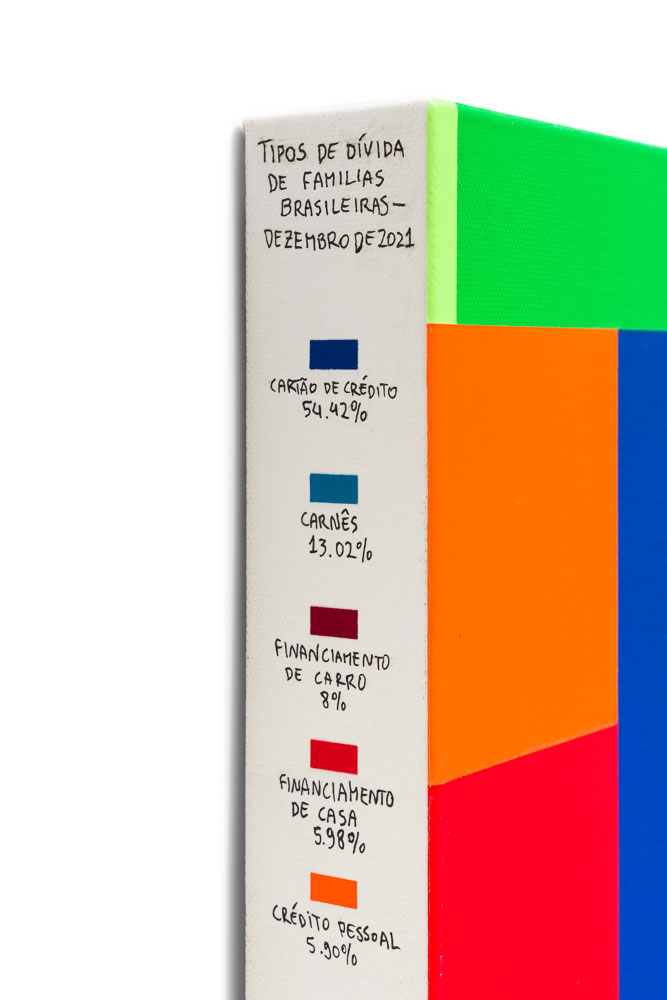
Untitled #25 (Types of debt held by Brazilian families – December, 2021)
acrylics, ink marker and varnish on canvas
30x30cm
2021
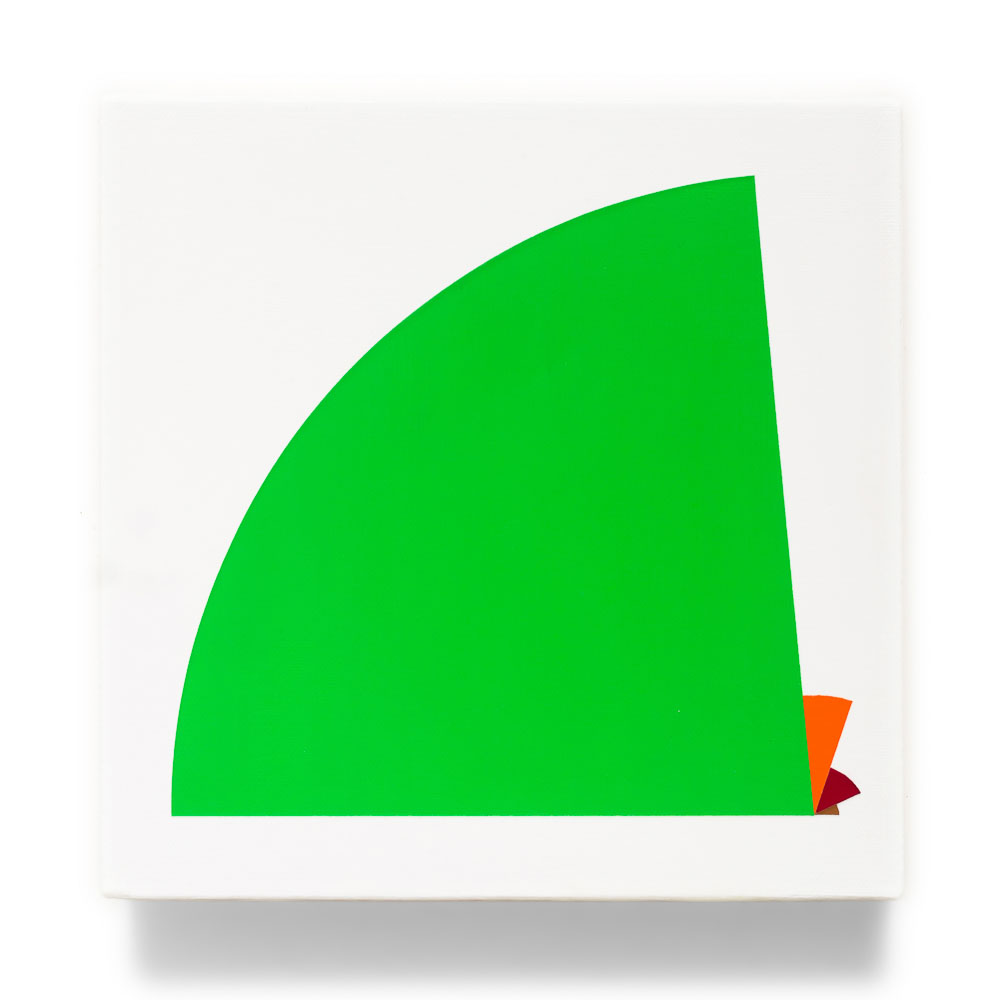
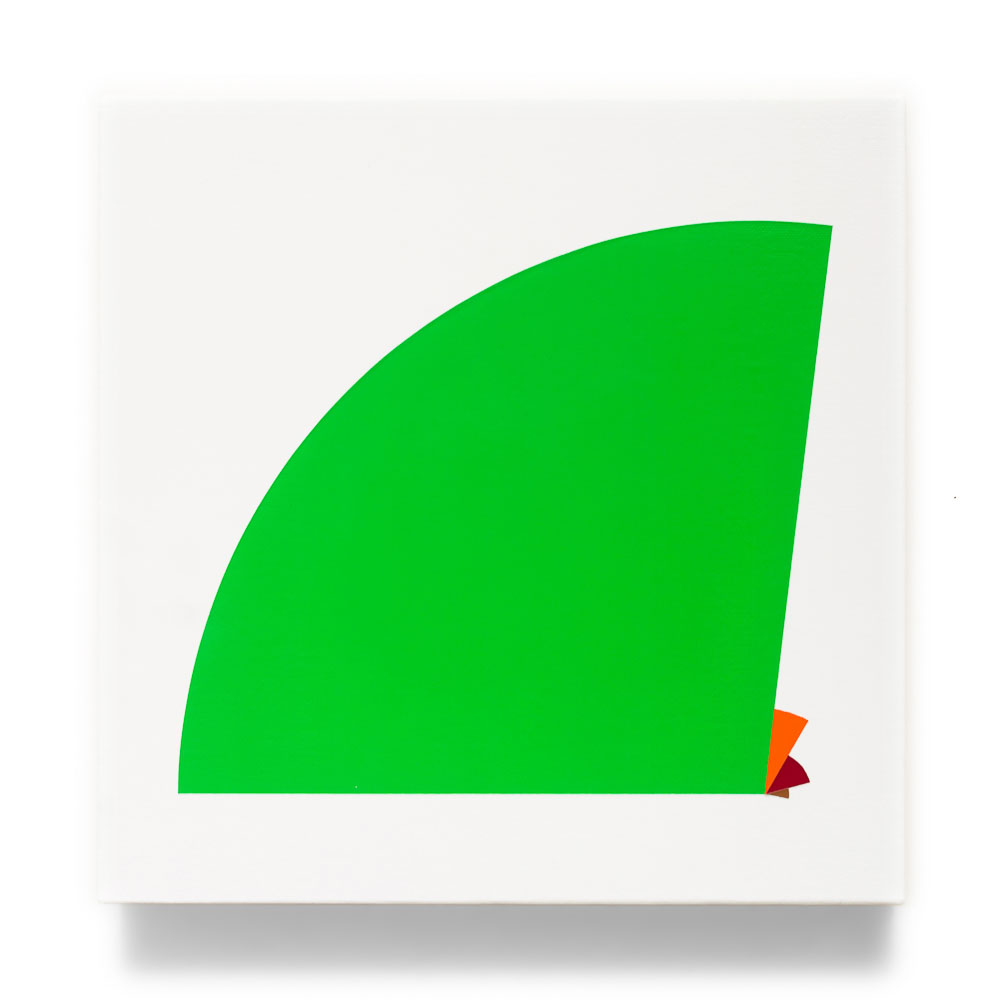
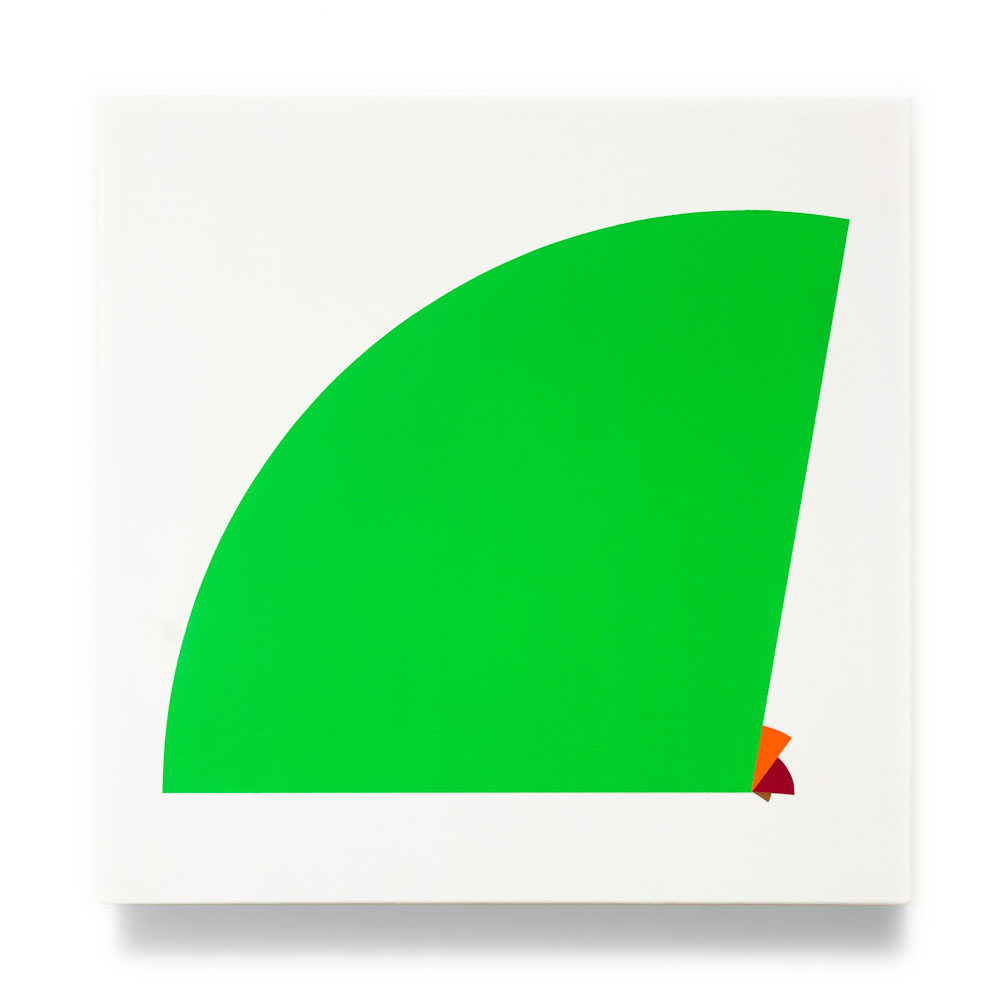
The paintings Untitled #26 to #29 present a graphic interpretation of the additional spending made in response to the COVID-19 pandemic by groups of countries organized according to their level of development. The numbers are from the International Monetary Fund, which started monitoring fiscal policies worldwide in periodic reports focused solely on the pandemic since June 2020. Each of these four paintings compiles data from one report, showing increasing (and quite unequal) spending among the groups. The radius of the circle is proportional to the total amount of money measured in US dollars, while the angle points to the average percentage of the GDP that the total spending represents.
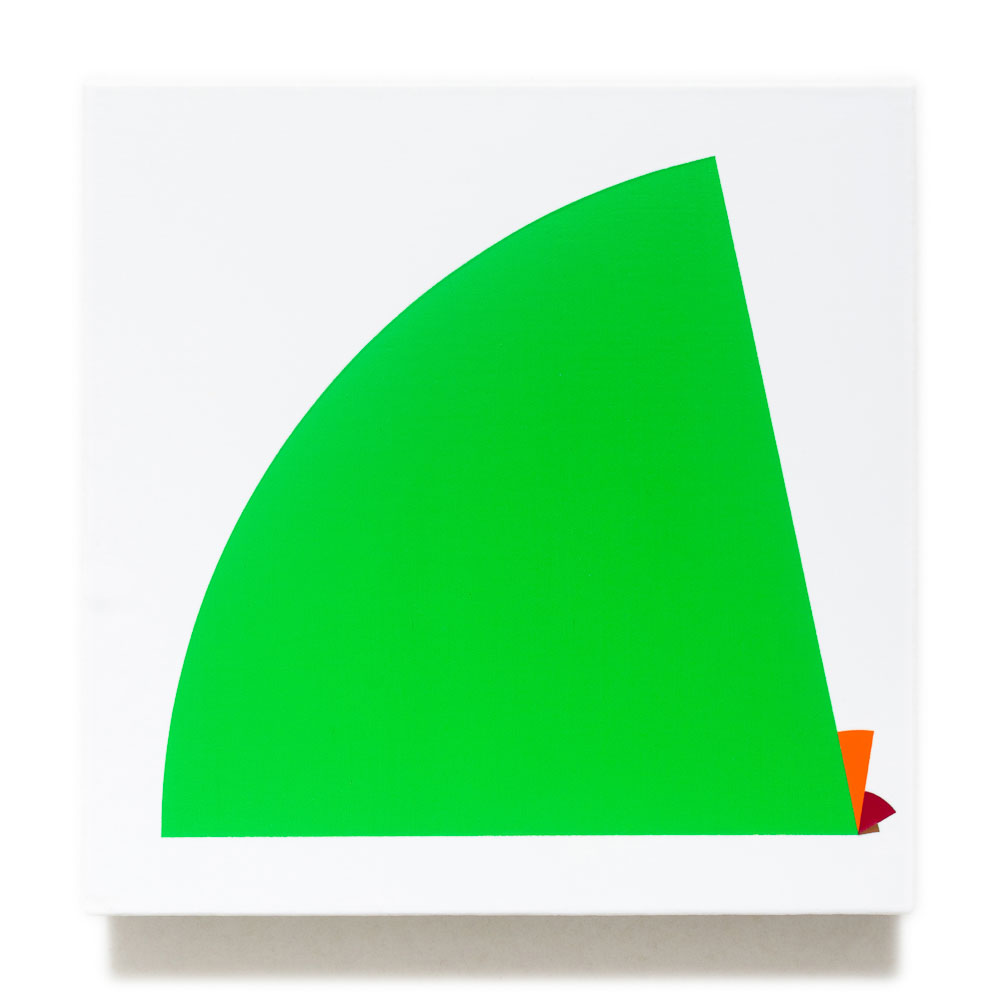
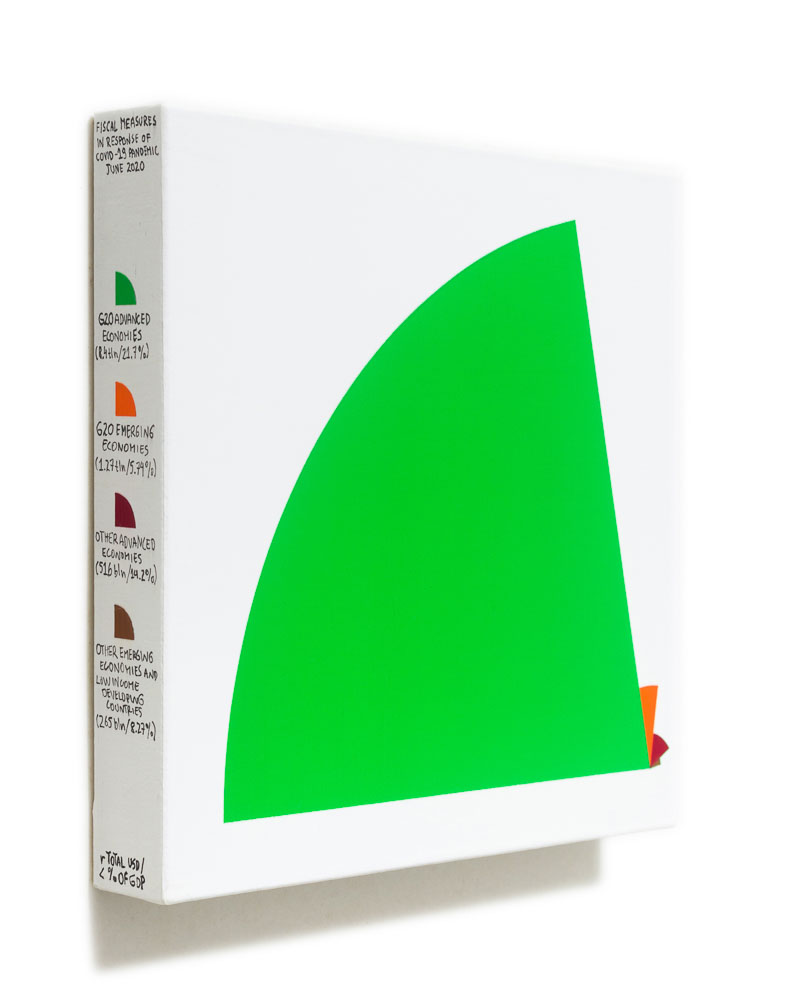
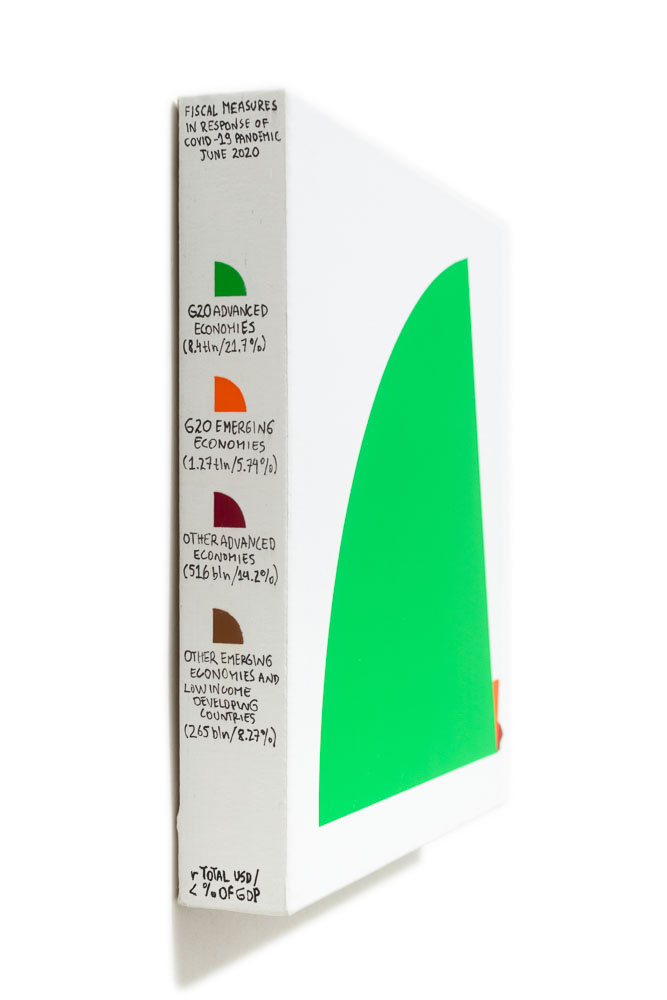
Untitled #26 (Fiscal measures in response to the COVID-19 pandemic, June 2020)
acrylics, ink marker and varnish on canvas
20x20cm
unique
2021
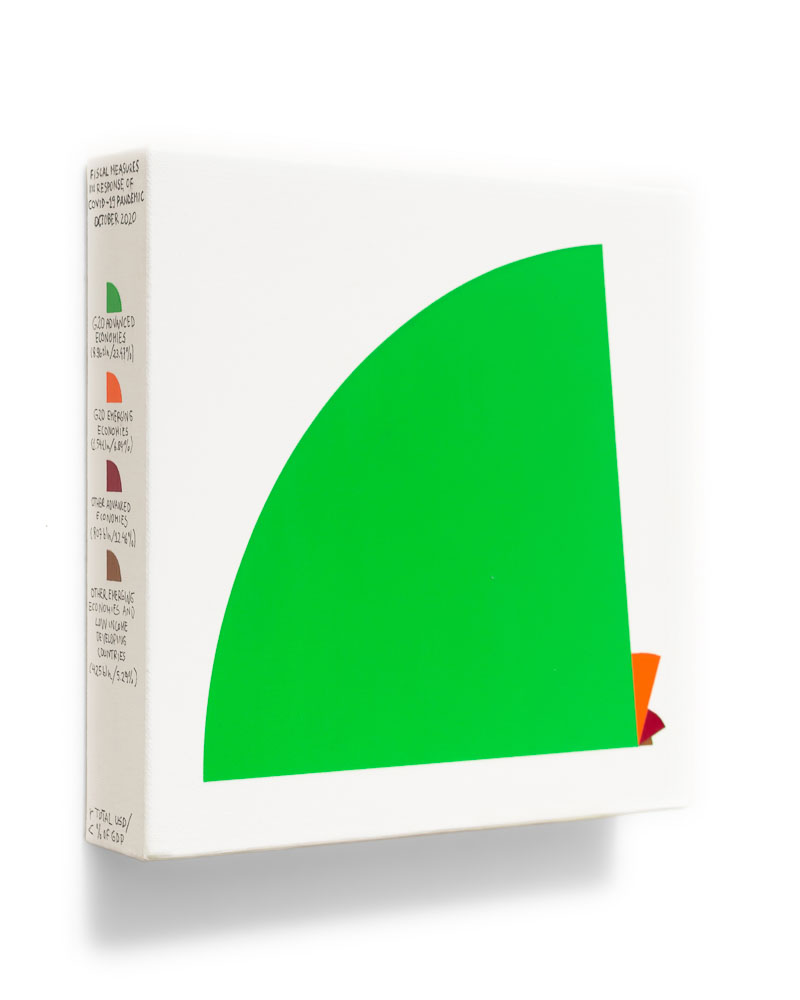
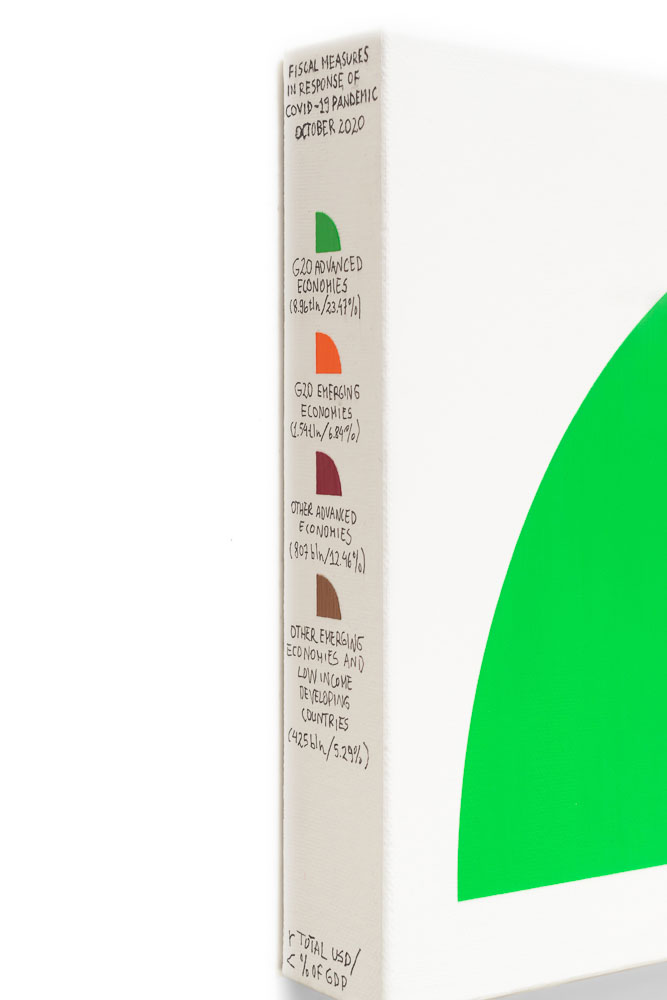
Untitled #27 (Fiscal measures in response to the COVID-19 pandemic, October 2020)
acrylics, ink marker and varnish on canvas
22×22 cm
2021
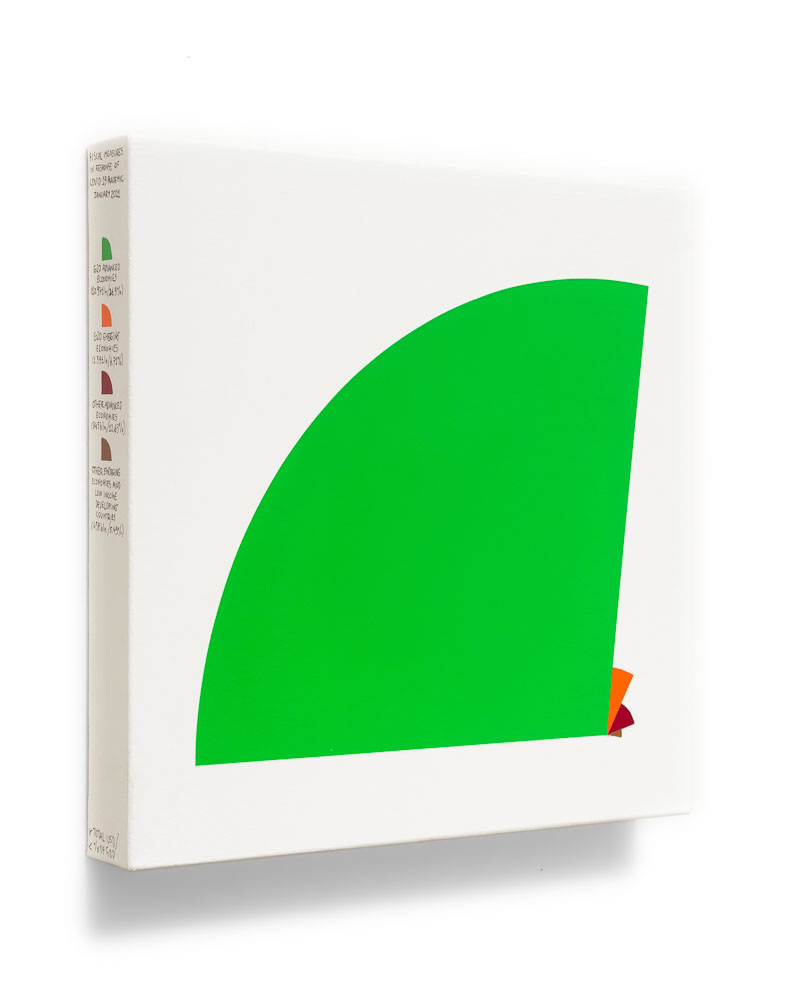
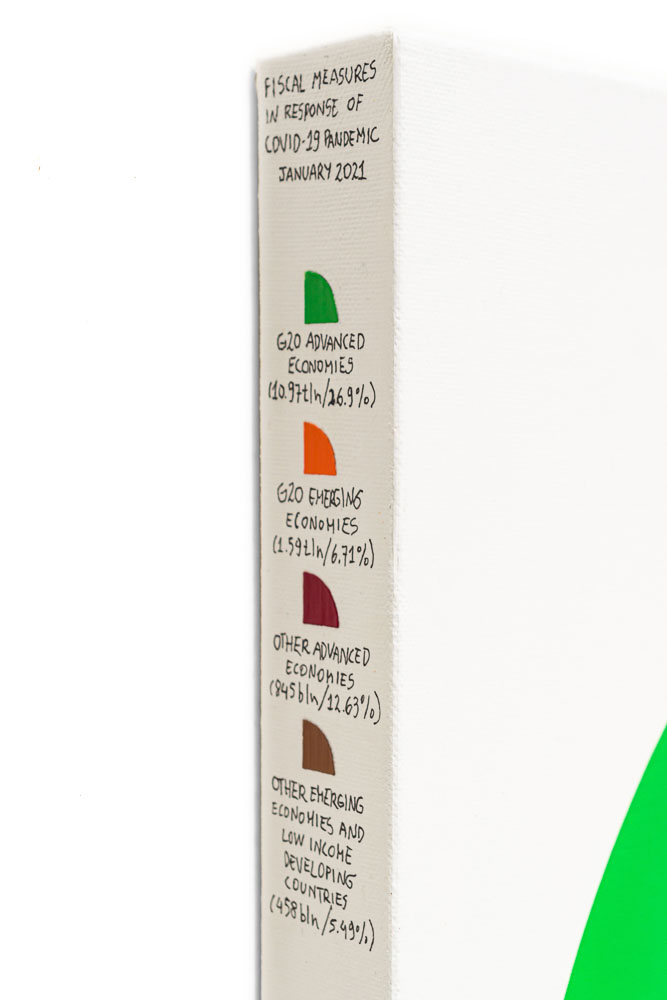
Untitled #28 (Fiscal measures in response to the COVID-19 pandemic, January 2021)
acrylics, ink marker and varnish on canvas
30×30 cm
2021
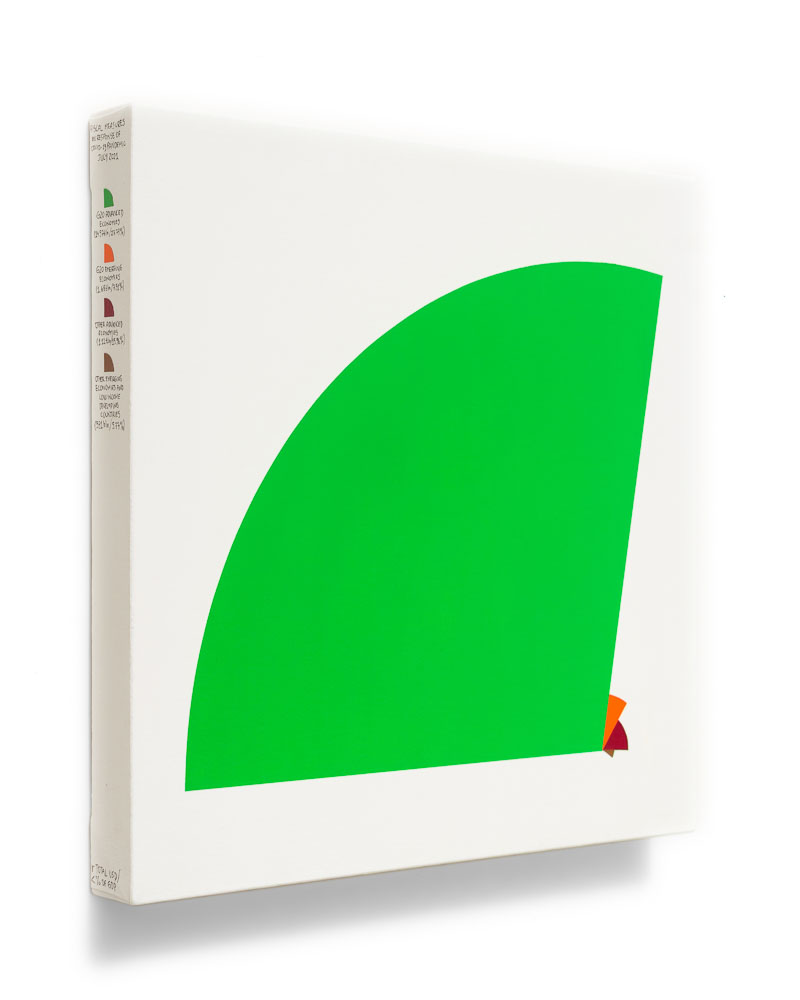
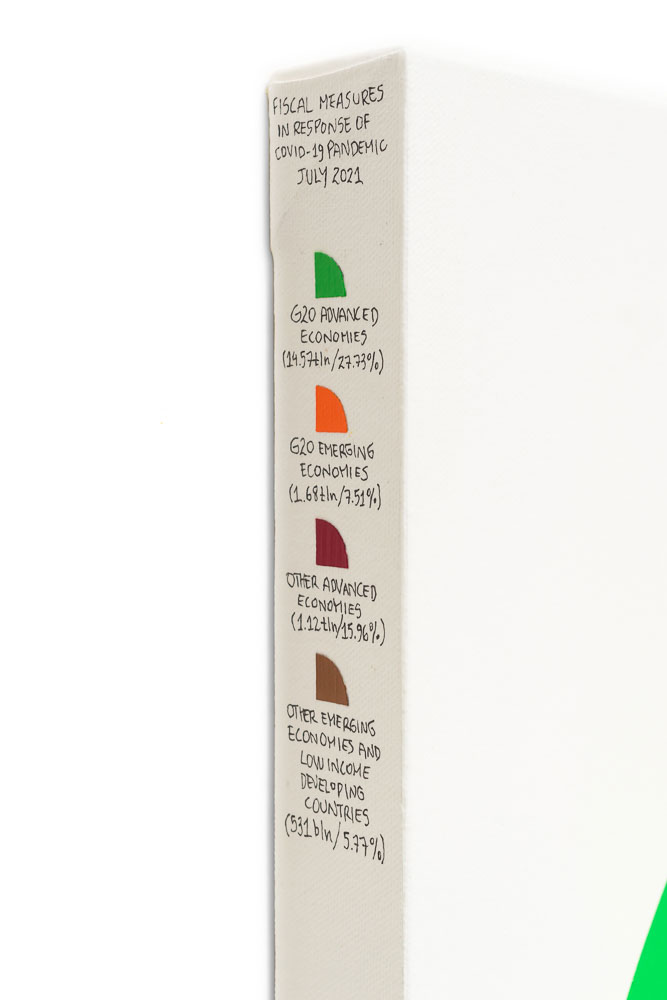
Untitled #29 (Fiscal measures in response to the COVID-19 pandemic, July 2021)
acrylics, ink marker and varnish on canvas
40×40 cm
2021
Untitled #30 uses the same IMF database referring to the quantification of July 2021, but it shows the spending made by 13 countries in relation to the rest of the world. Unlike the previous paintings, the size of the circle’s angle relates to the amount spent by each country, while the radius presents the spending equivalence as a percentage of a particular country’s GDP.
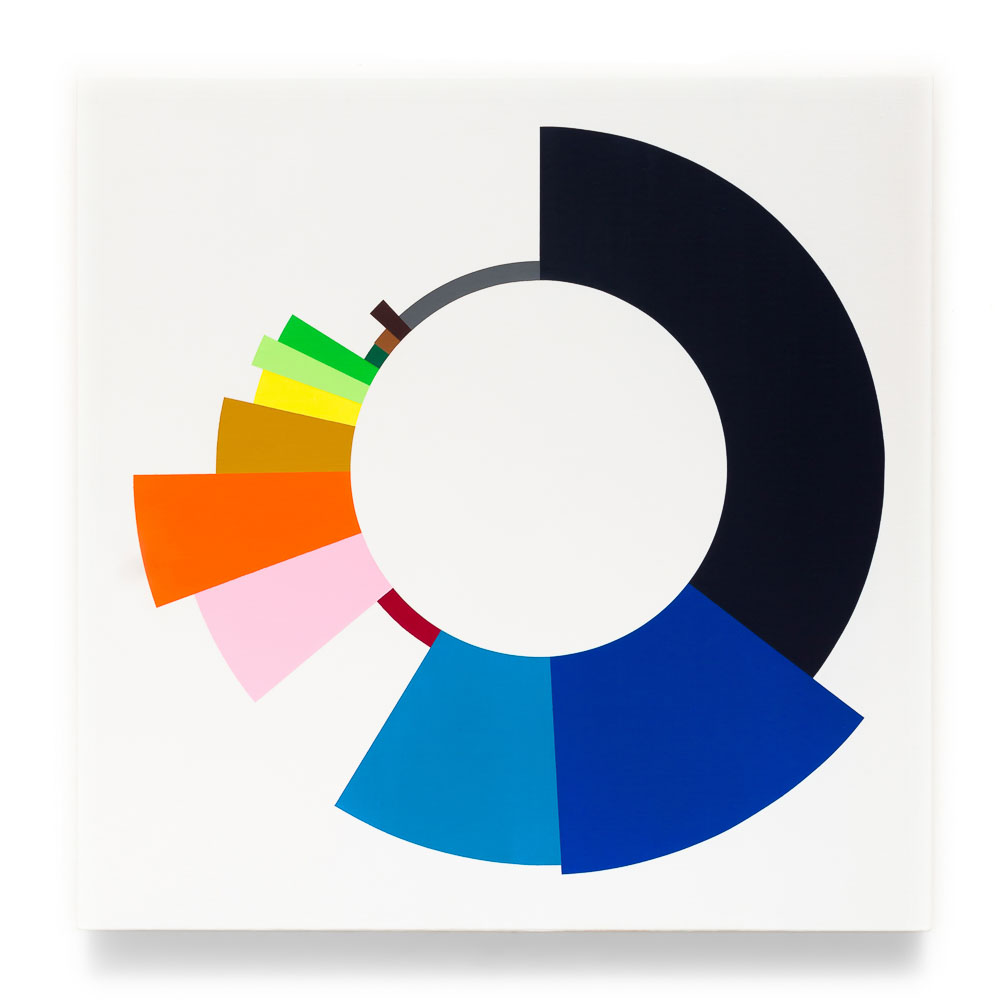
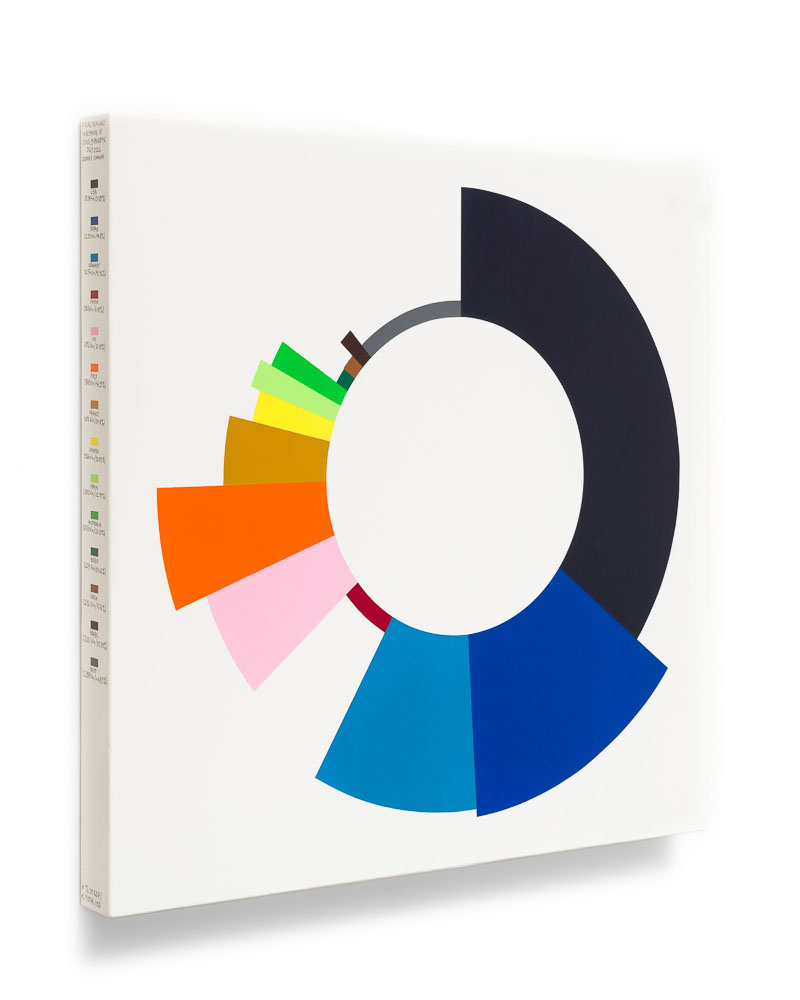
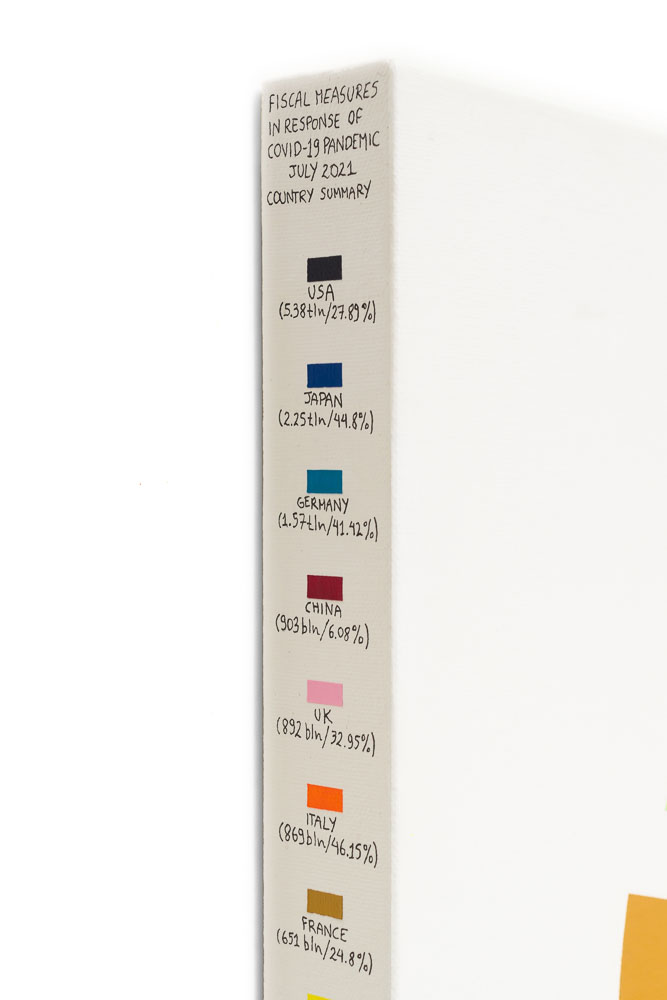
Untitled #30 (Fiscal measures in response to the COVID-19 pandemic, July 2021, country summary)
acrylics, ink marker and varnish on canvas
50×50 cm
2021
Untitled #31 was created from the leak of data from the United States Internal Revenue Service, first seen in June 2021 in the report The Secret IRS Files: Trove of Never-Before-Seen Records Reveal How the Wealthiest Avoid Income Tax, by the investigative journalism agency ProPublica. By correlating wealth, reported income, and taxes paid by four of the richest individuals in the US between 2014 and 2018, the chart puts into perspective an economic landscape of tax privileges for billionaires, opening the discussion for taxing large fortunes.
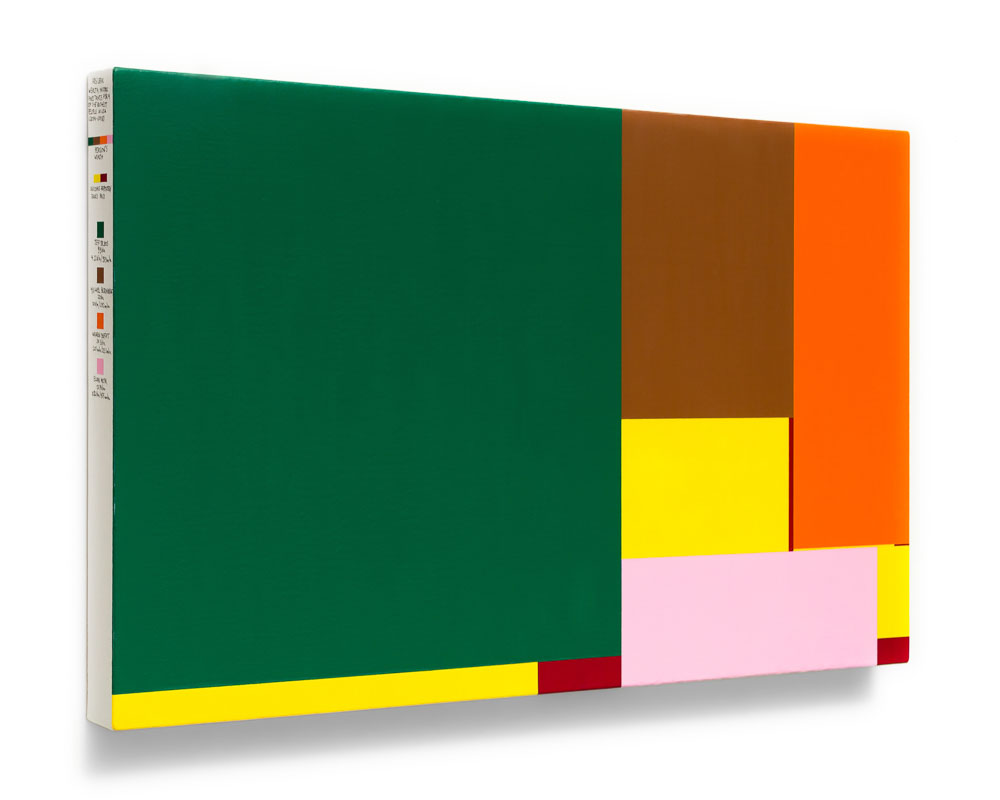
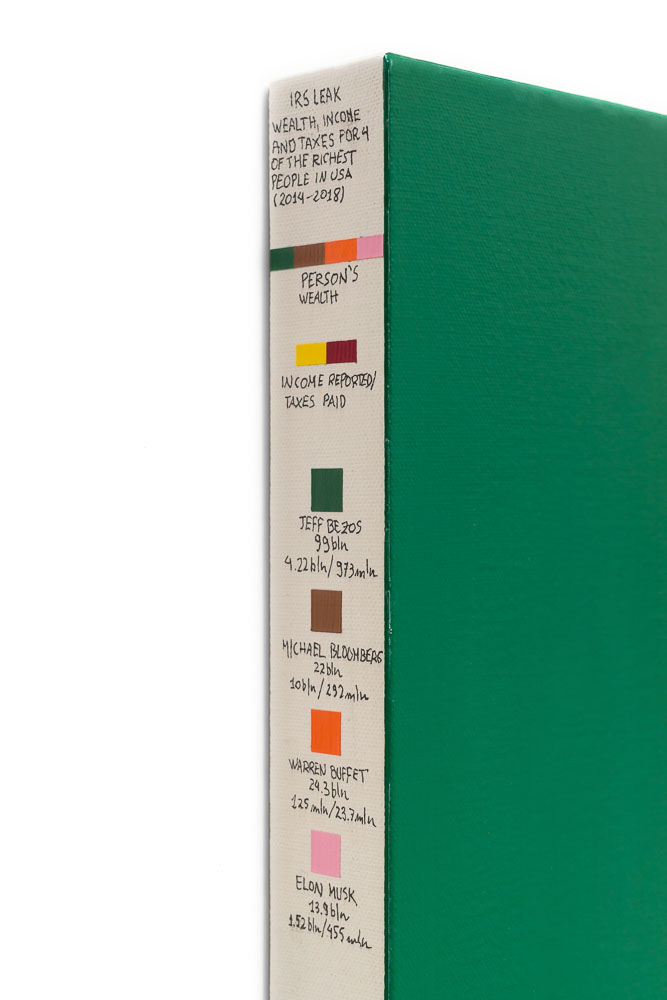
Untitled #31 (IRS leak, wealth, income and taxes for 4 of the richest people in USA, 2014-2018)
acrylics, ink marker and varnish on canvas
40×65 cm
2021
Untitled #32 was commissioned by the curator of the exhibition “Brazilian Stories”, at MASP. The composition aggregates data on income inequality in Brazil obtained from two different sources. The color fields correspond to data from the World Inequality Database that point to the growth of the index in the period, while the white line brings the Gini coefficient estimated by Insper in a study published in 2021 showing a reduction in inequality in part of the analyzed period, but indicating an increase from 2016.
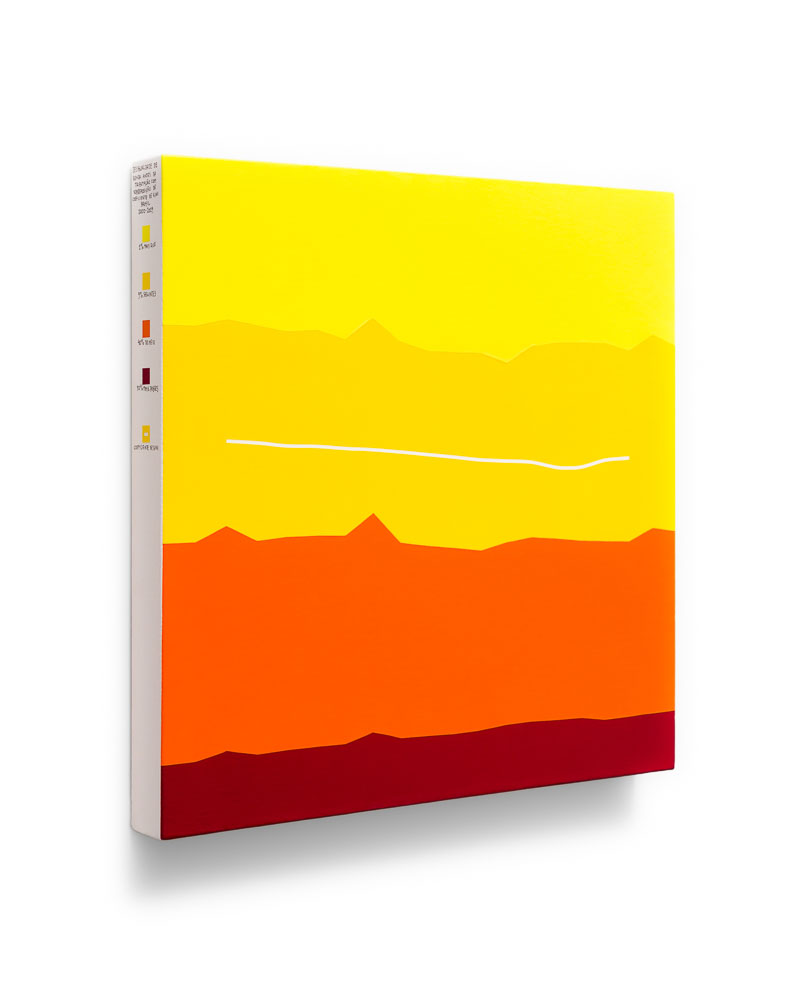
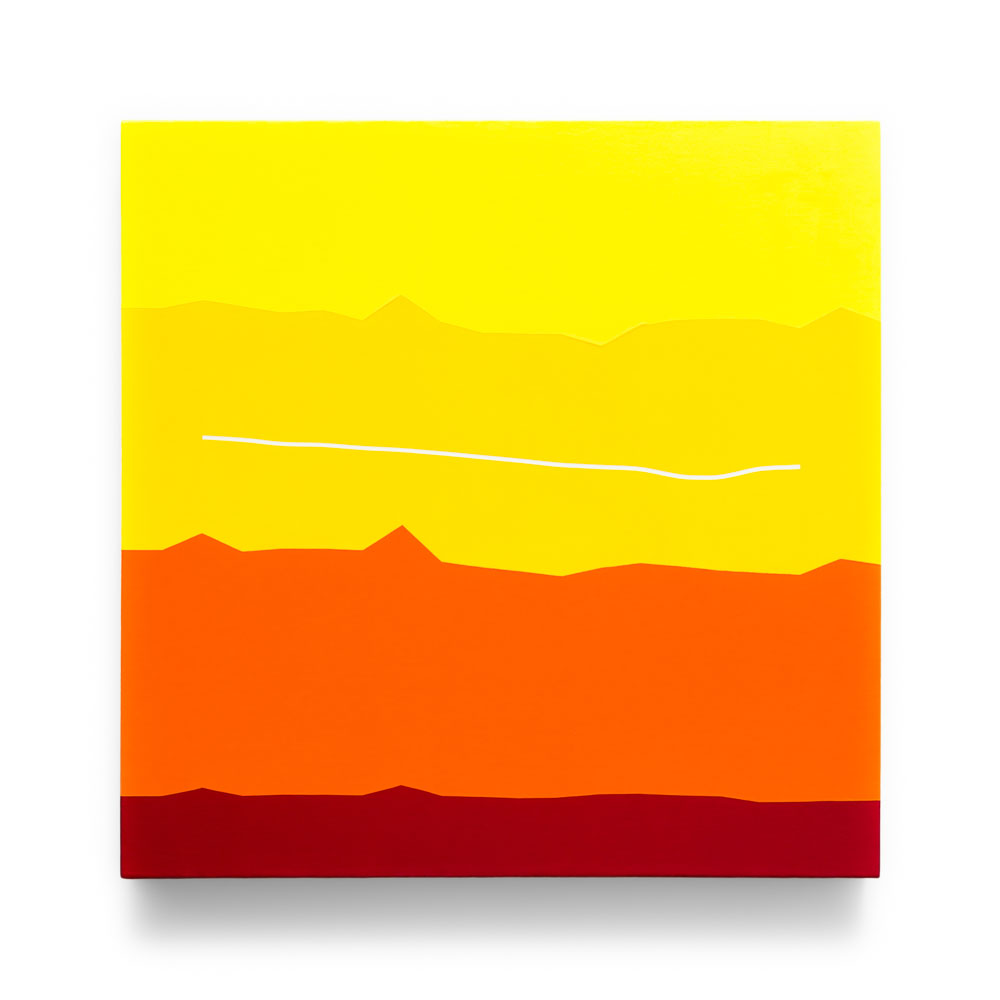
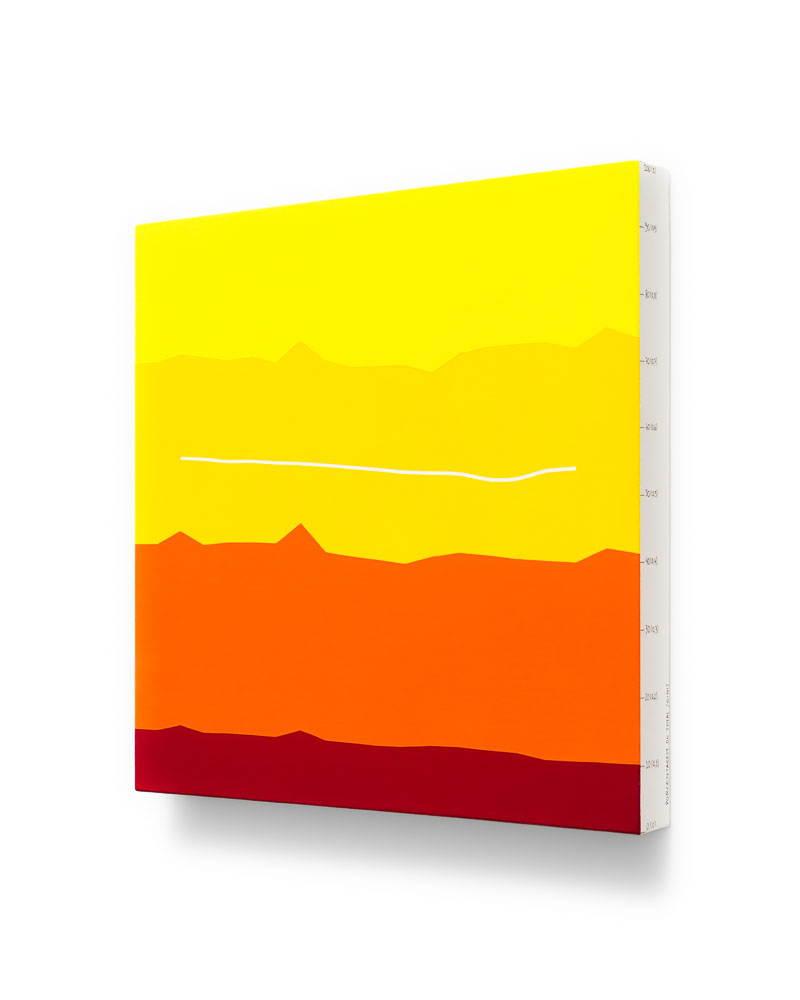
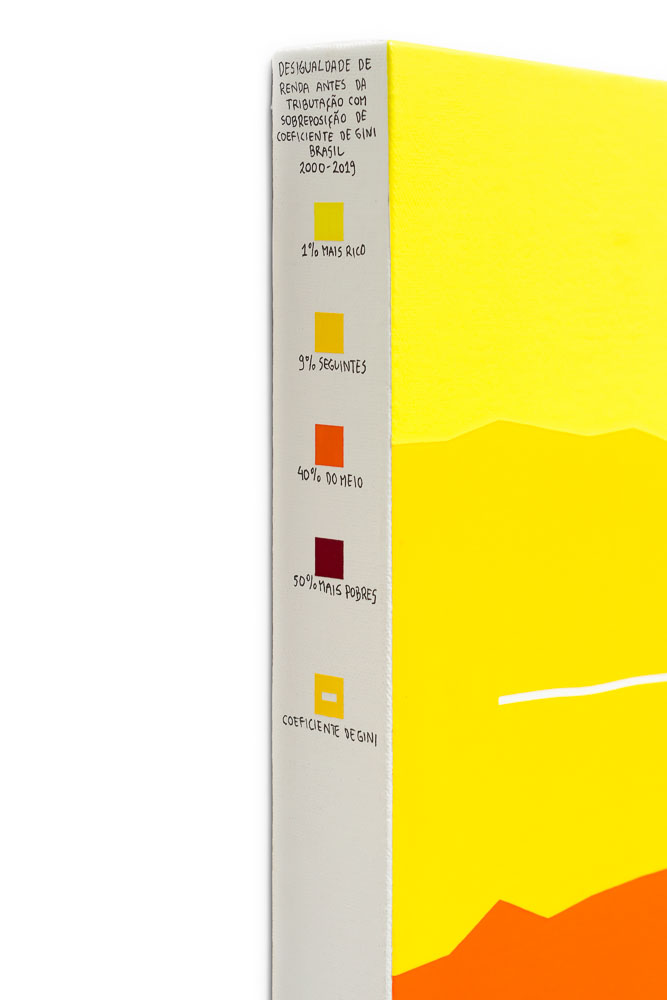
Untitled #32 (Pre-tax income inequality with Gini coefficient overlap, Brazil, 2000-2019)
acrylics, ink marker and varnish on canvas
40x40cm
2021
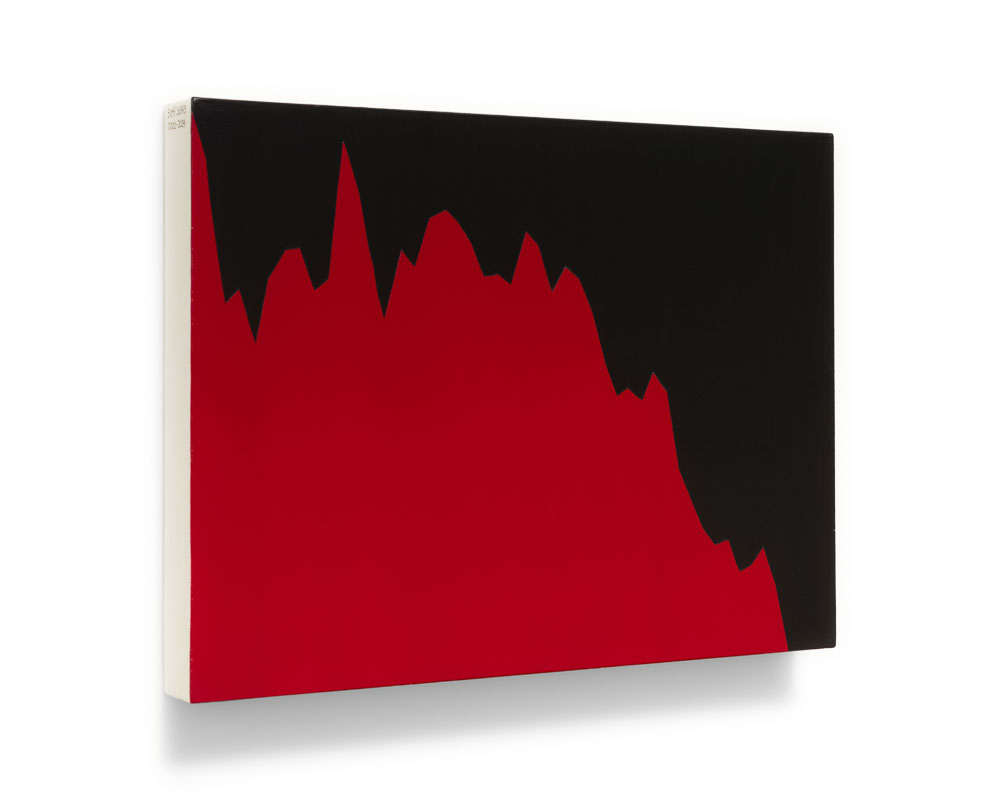
From data provided by Comissão de Valores Imobiliários (Brazilian equivalent of SEC) to professors Fernando Chague and Bruno Giovannetti (EESP-FGV), it is possible to detect a pattern of wealth transfer from retail investors to investment fund operators in the modality of e-mini contracts traded on the stock exchange. The composition groups the data into quarters to highlight a single quarter of profit for individuals and only one quarter of loss for legal entities in the analyzed period (2012-2017).
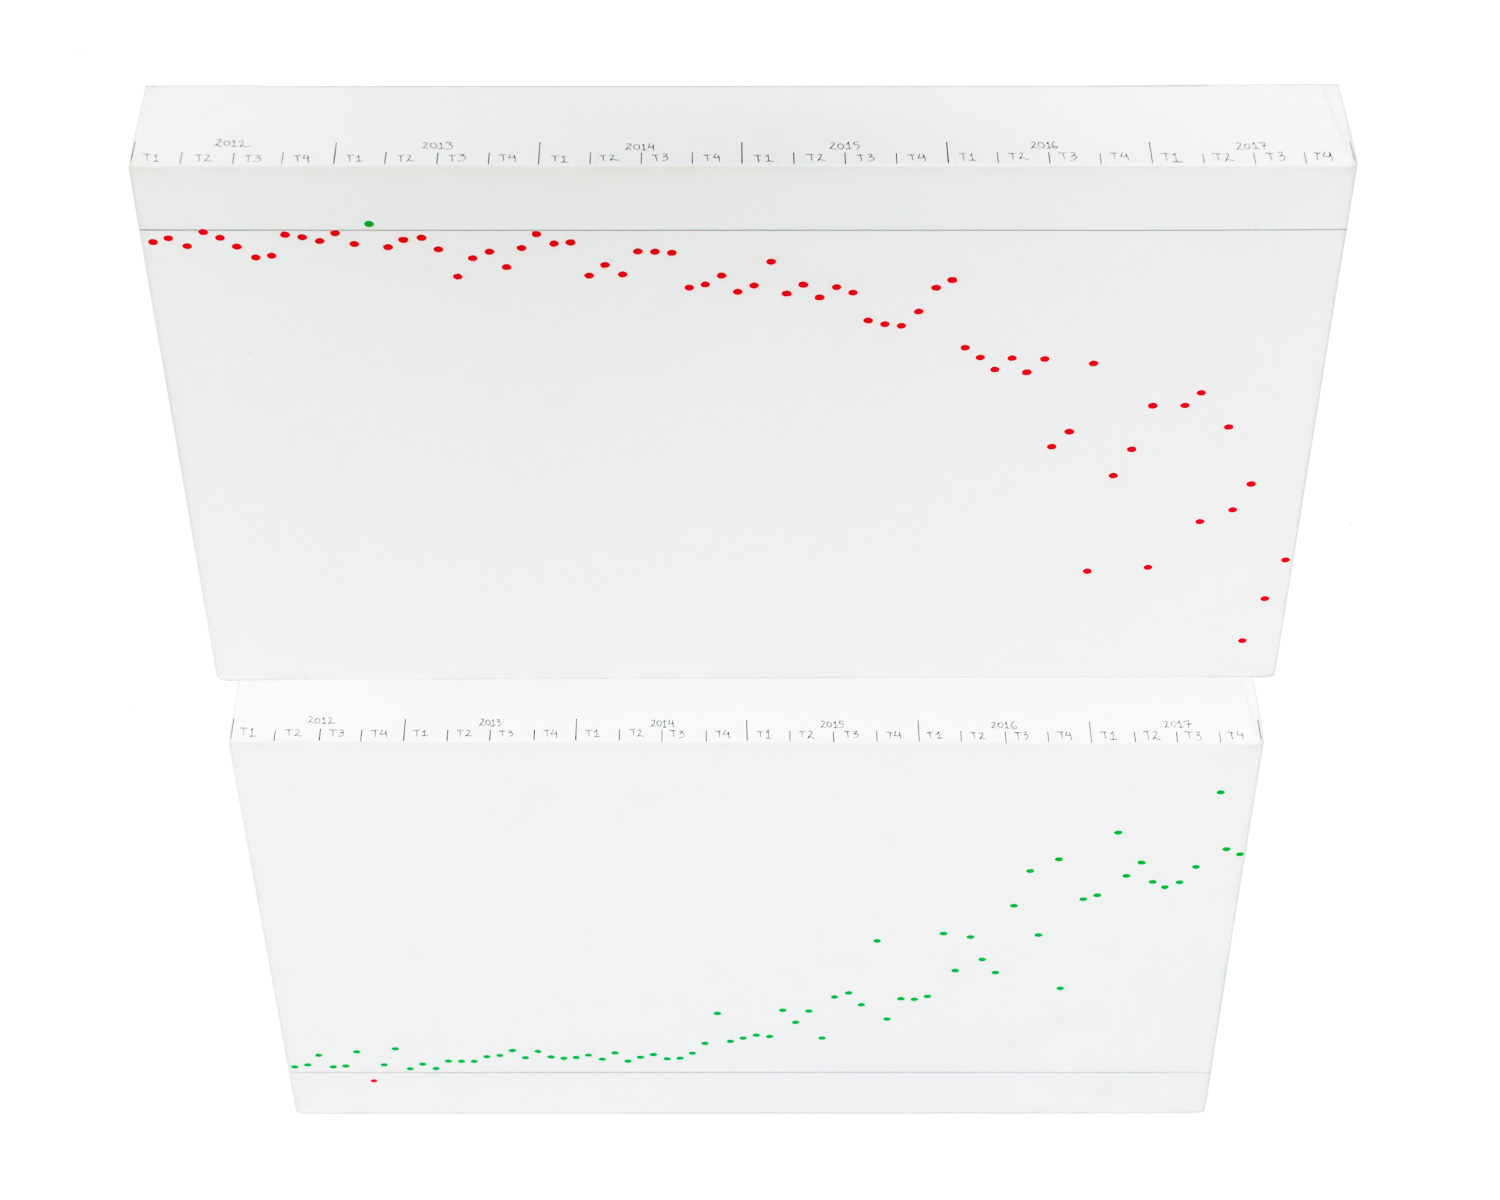
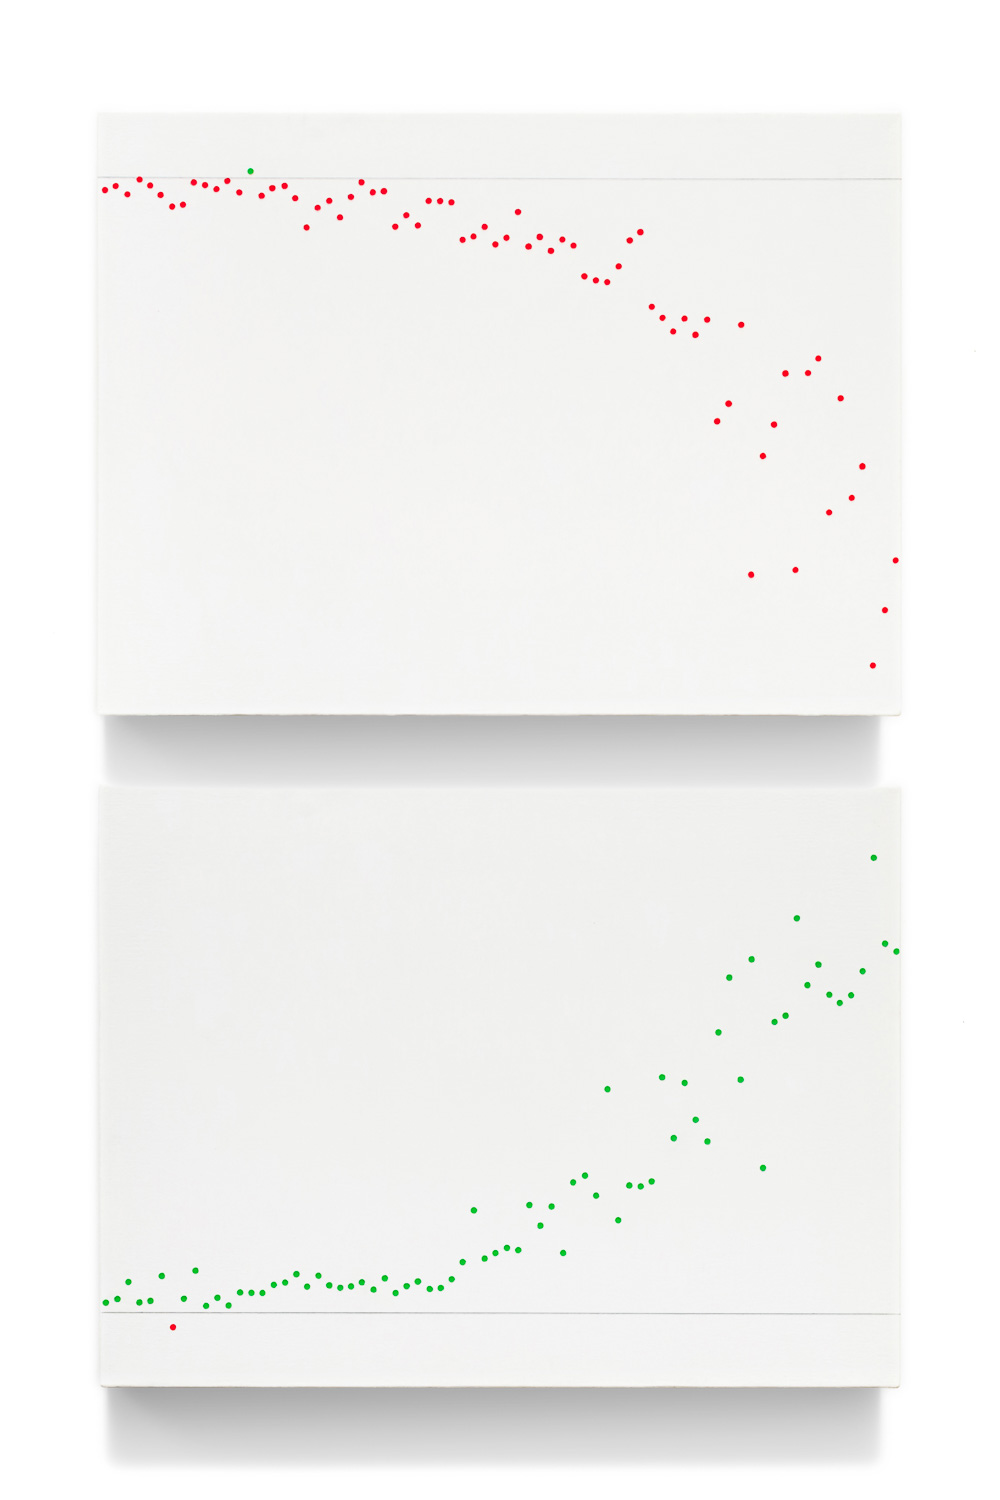
Untitled #33 (Day-trade results with index and dollar e-mini contracts, natural and legal entities, 2012-2017)
acrylics, ink marker, and varnish on canvas
diptych, 30×40 cm (each)
2022
In 2021, data gathered by the Stockholm International Peace Research Institute showed that for the first time, military spending in the world exceeded 2 trillion dollars annually. The composition shows percentages of this amount across the five continents over a 30-year period.
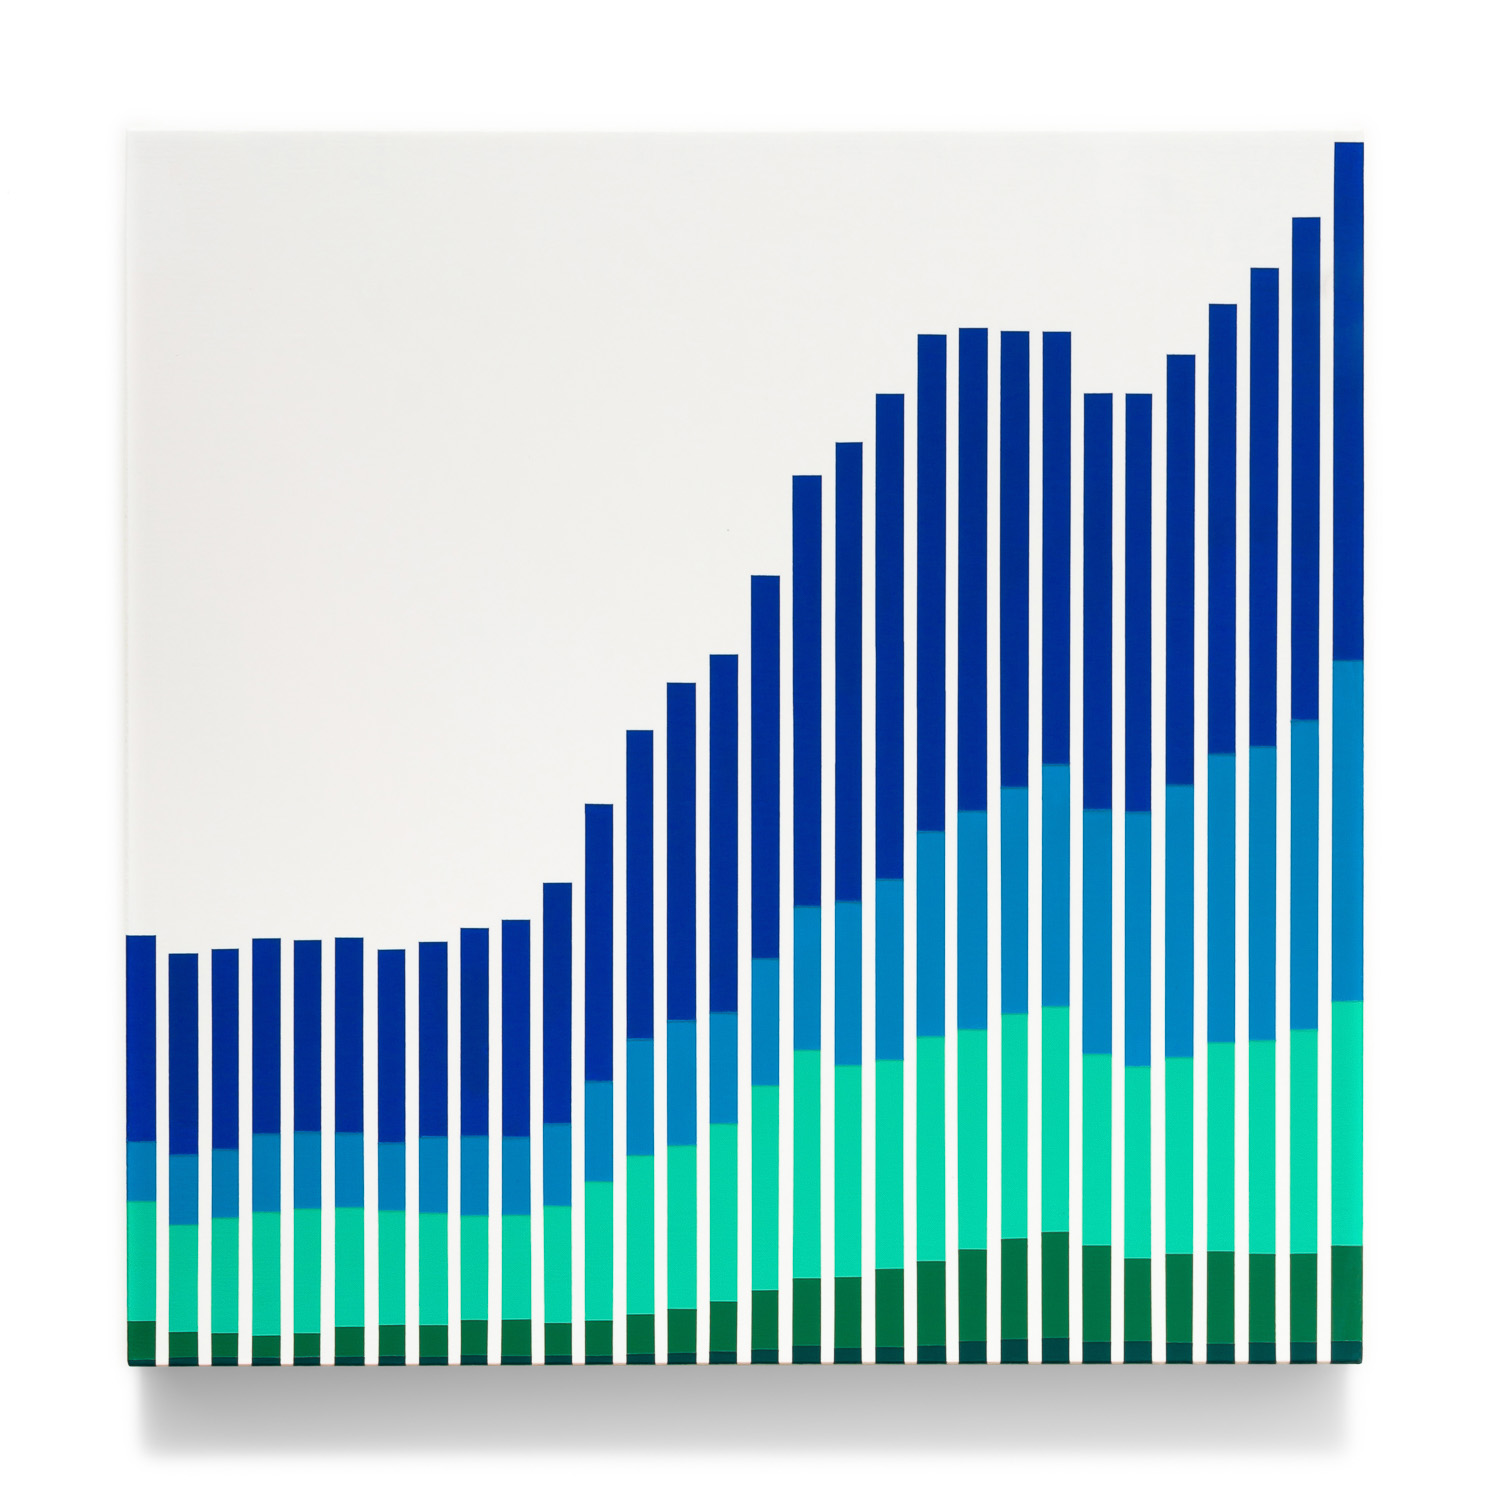
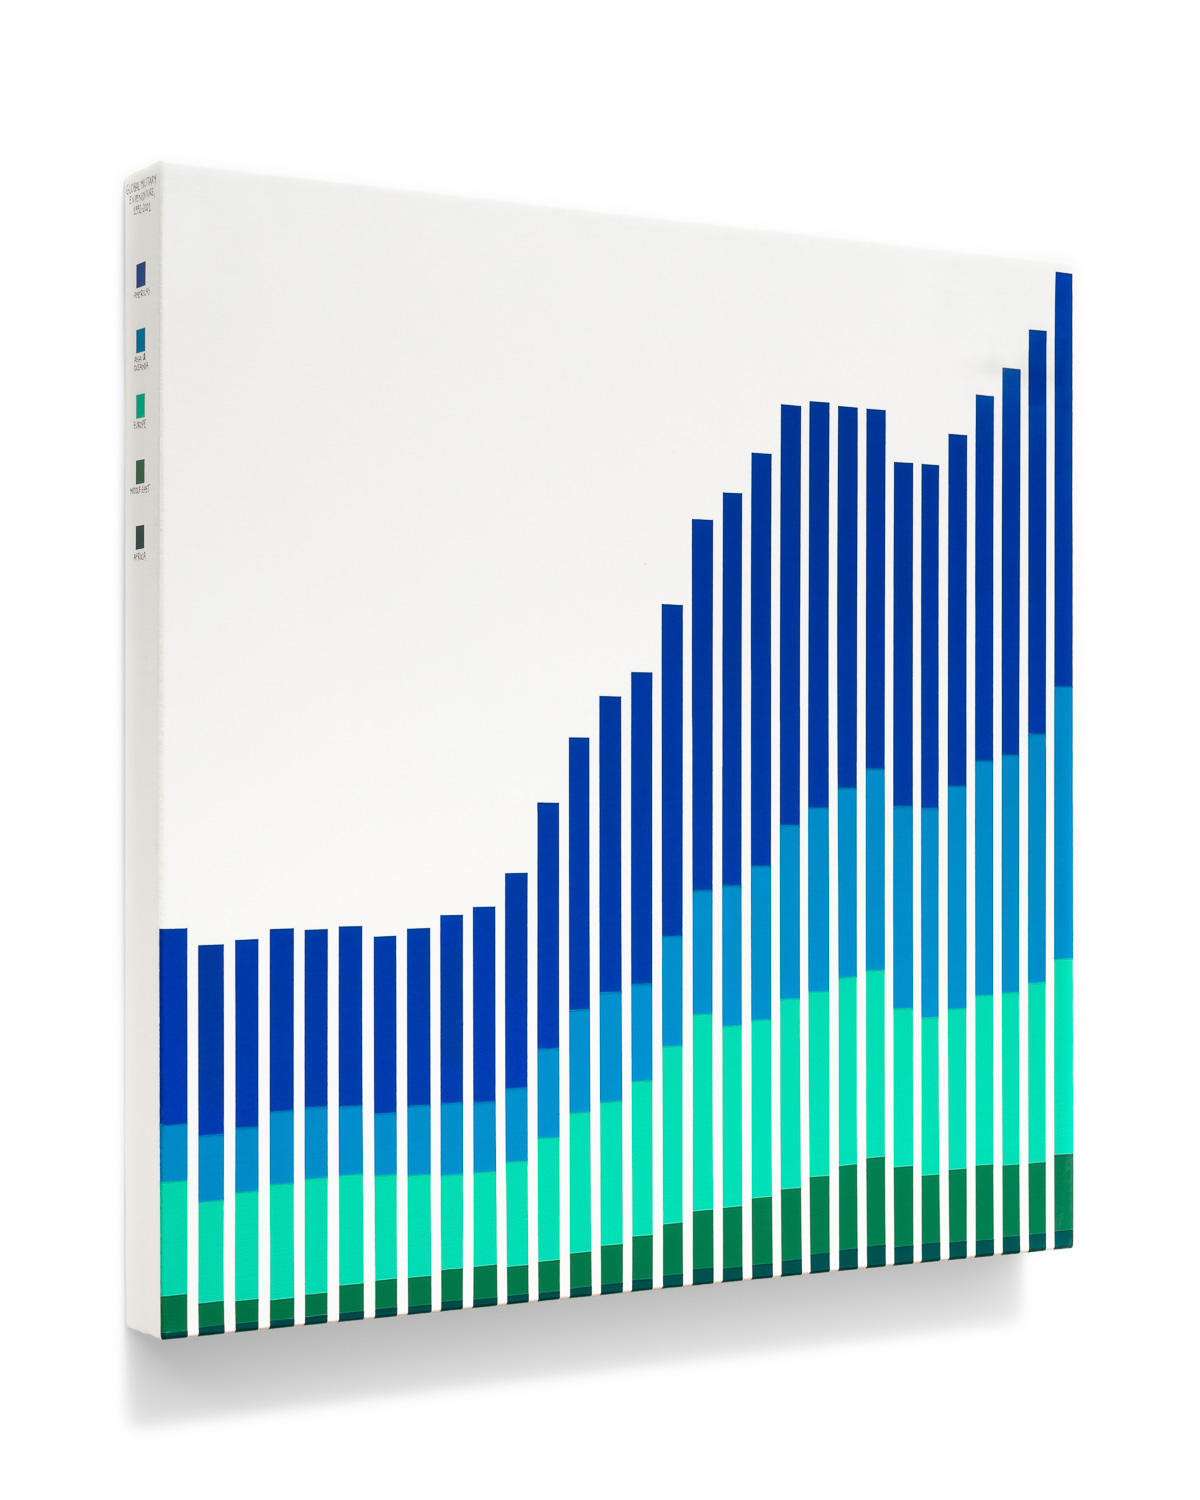
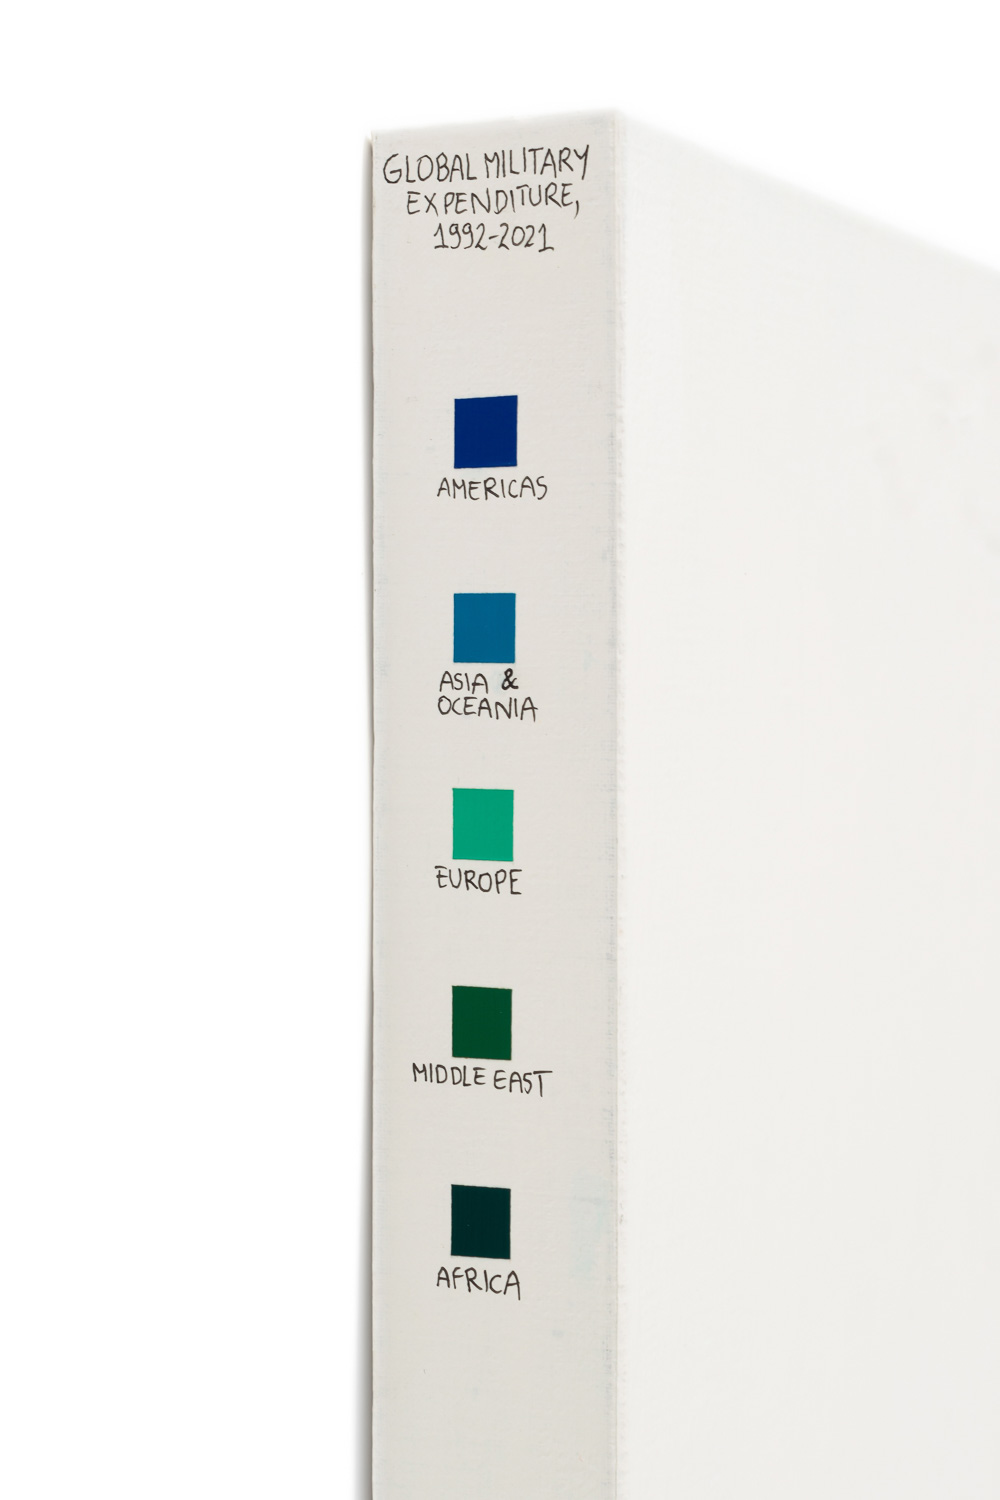
Untitled #34 (Global military expenditure, 1992-2021)
acrylics, ink marker, and varnish on canvas
50×50 cm
2022
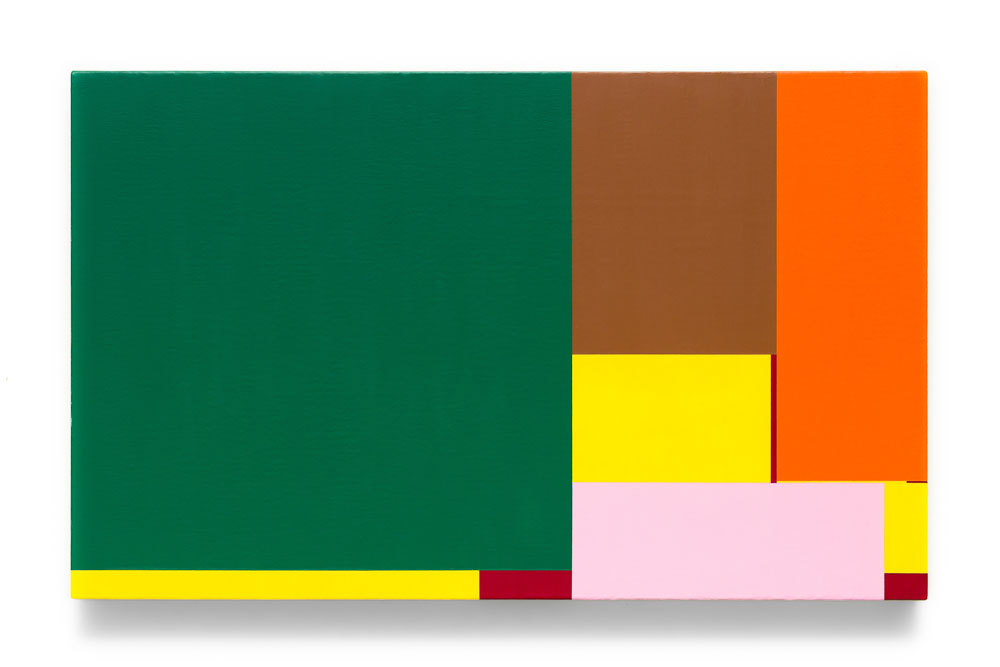
Untitled #35 to #38 is a set developed during a residency at Ybytu with about 10 databases that provide an assessment of sectors of the Brazilian economy at the end of a recession period. The palette used corresponds to the complementary (negative) colors of the Brazilian flag. #35 compares three corruption scandals using data from Polícia Federal, Ministério Público Federal, Tribunal de Contas da União, PricewaterhouseCoopers, Petrobras’ balance sheets (2014) and Lei de Diretrizes Orçamentárias (2020-2023). #36 highlights the flow of national capital towards tax havens using data from the Brazilian Central Bank’s Direct Investment Report and the Tax Justice Network’s Financial Secrecy Index. #37 compares physical and digital crimes with fraud data from Febraban and Serasa Experian. #38 shows the increase in extreme poverty in Brazil, with data from PNAD-contínua.
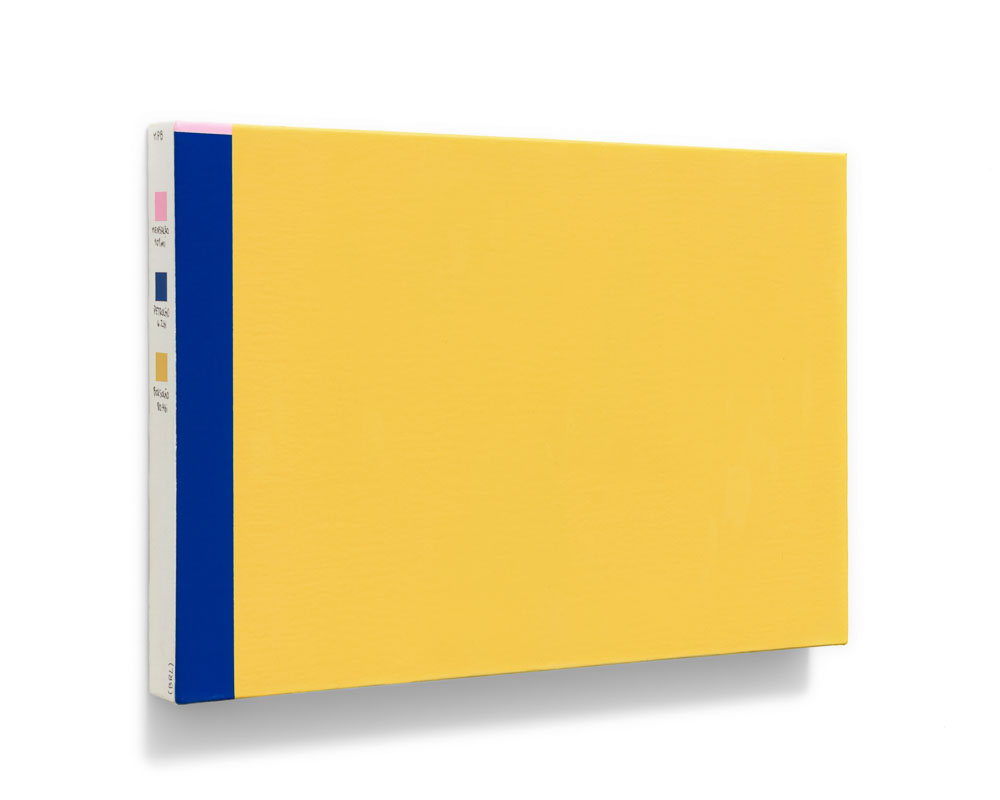
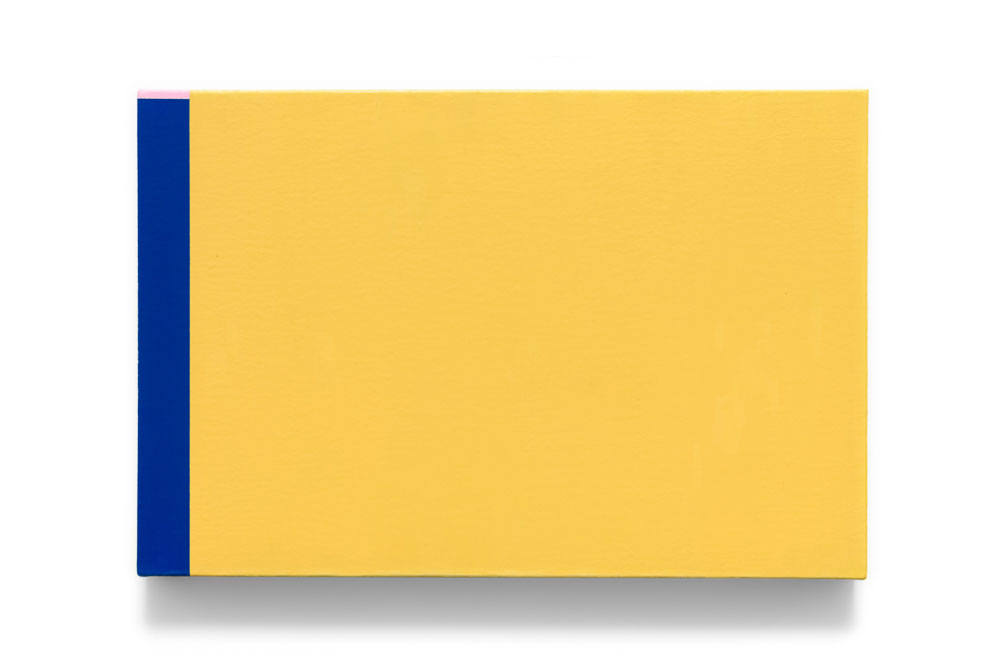
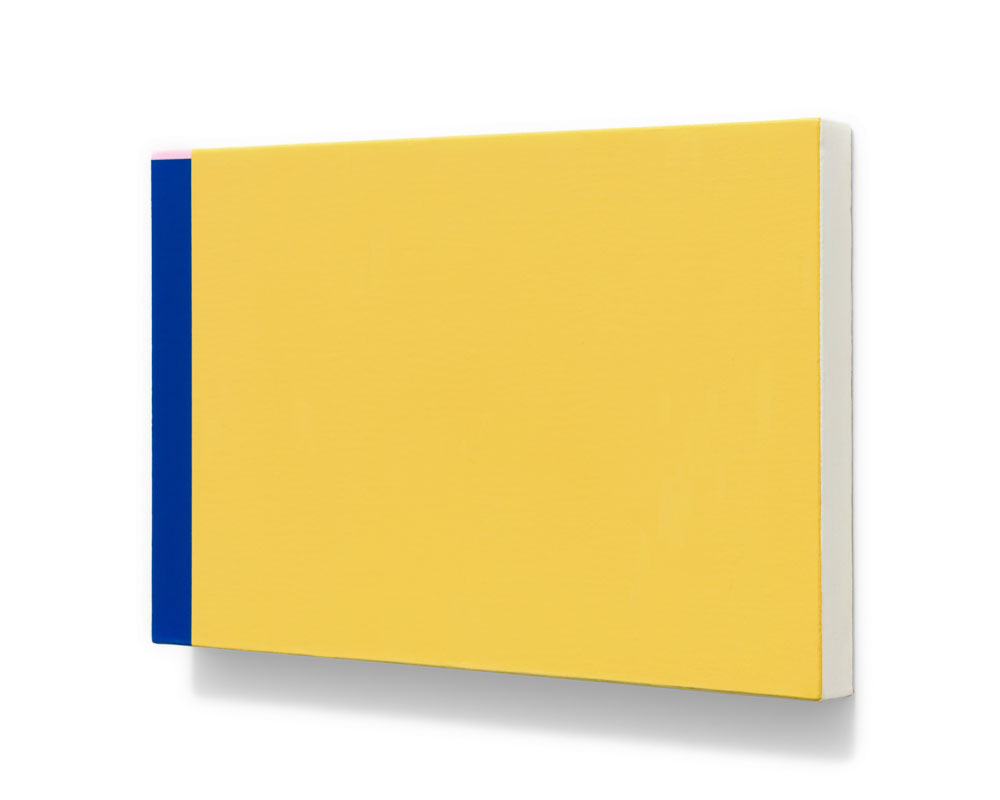
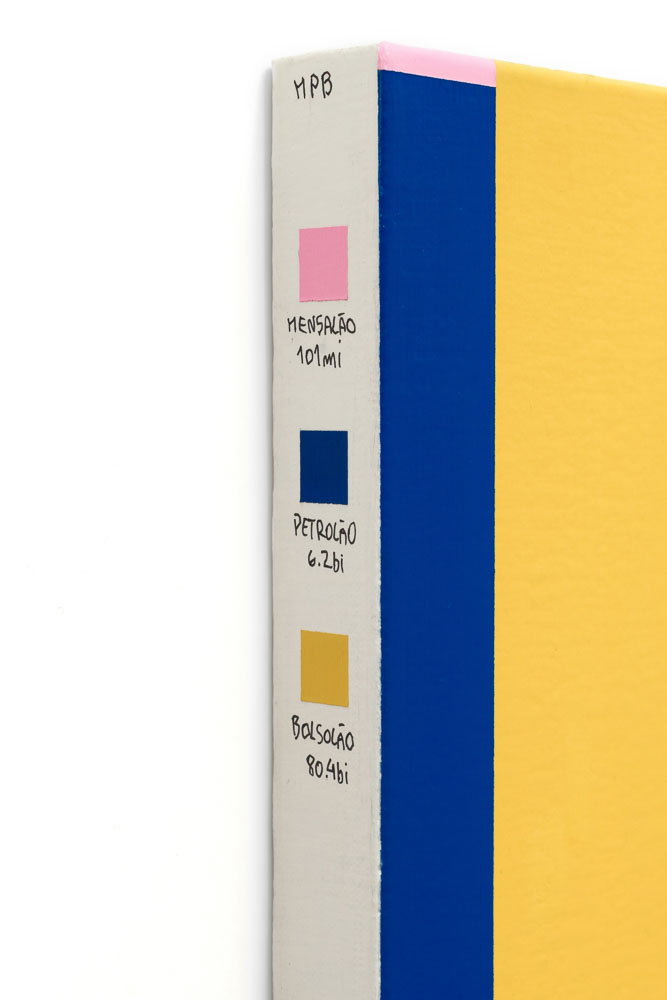
Untitled #35 (Mensalão, Petrolão, Bolsolão)
acrylics, ink marker, and varnish on canvas
20×30 cm
2022
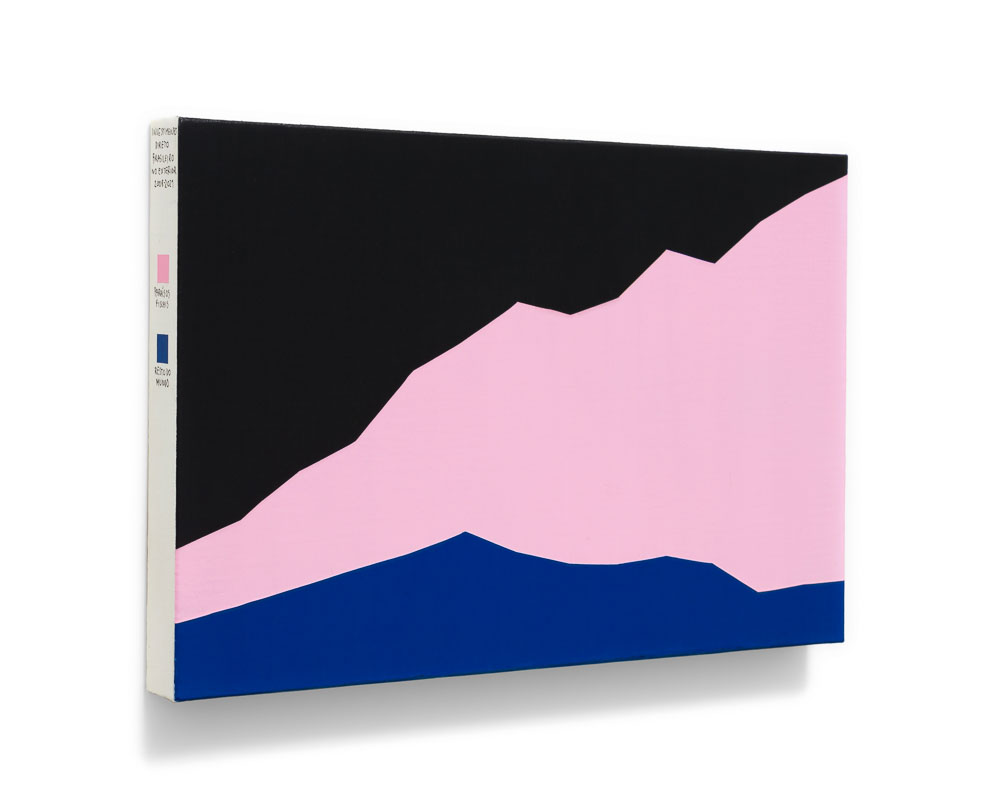
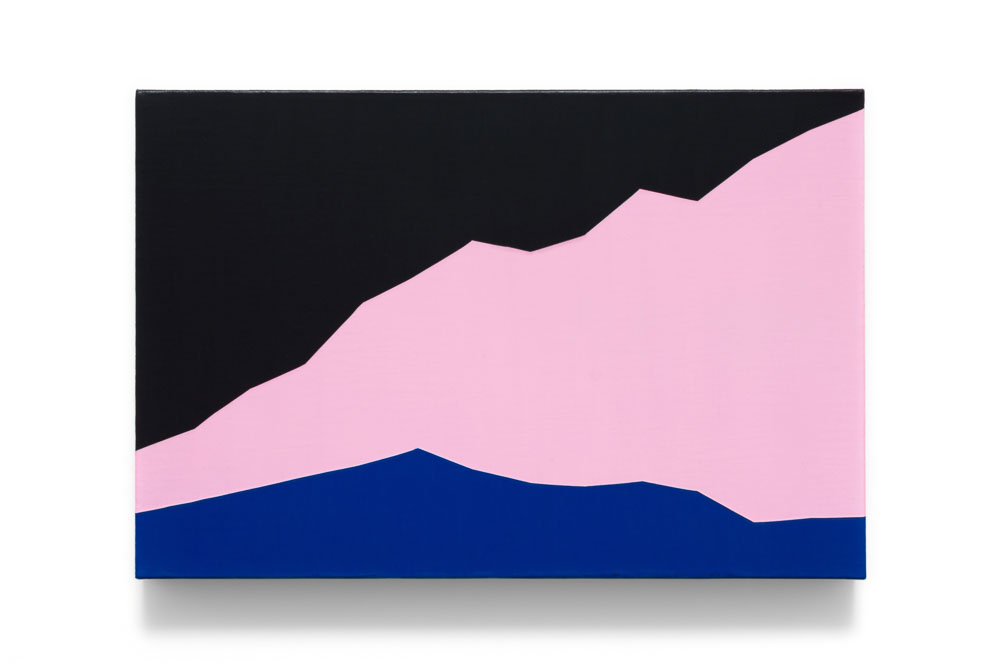
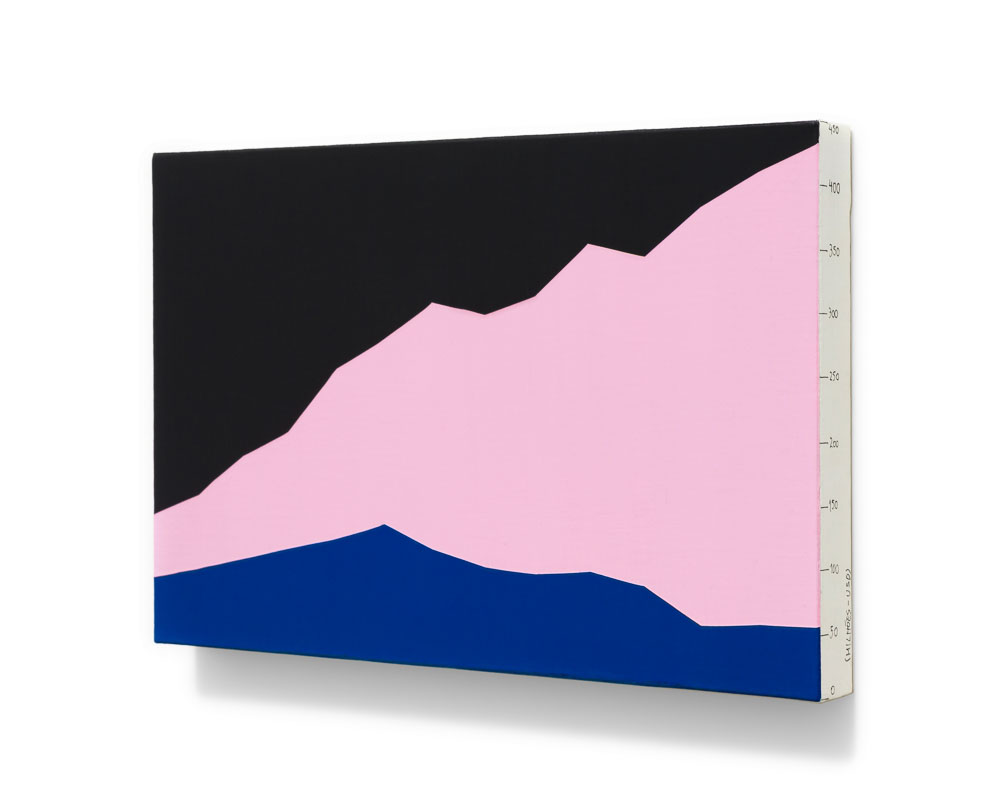
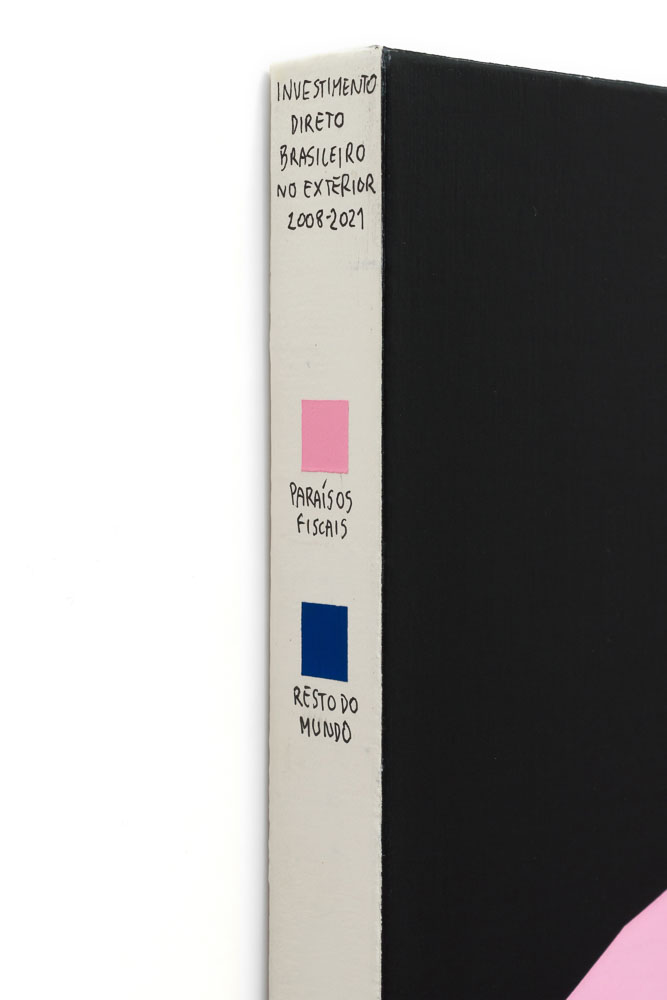
Untitled #36 (Brazilian direct investment abroad, 2008-2021)
acrylics, ink marker, and varnish on canvas
20×30 cm
2022
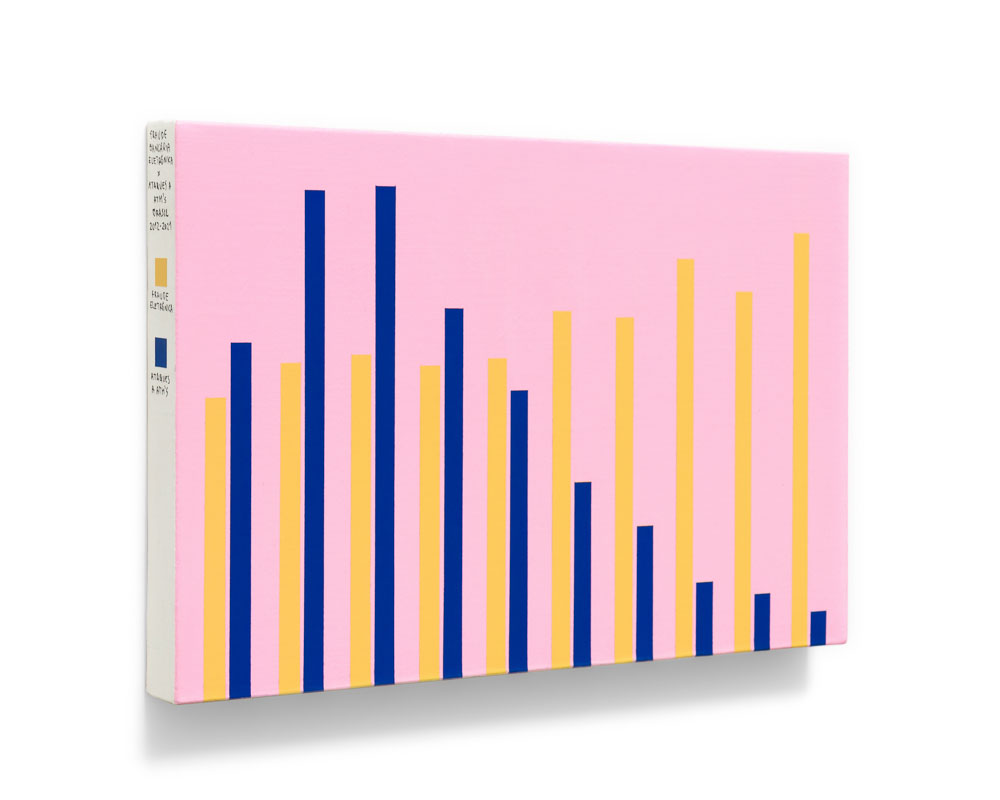
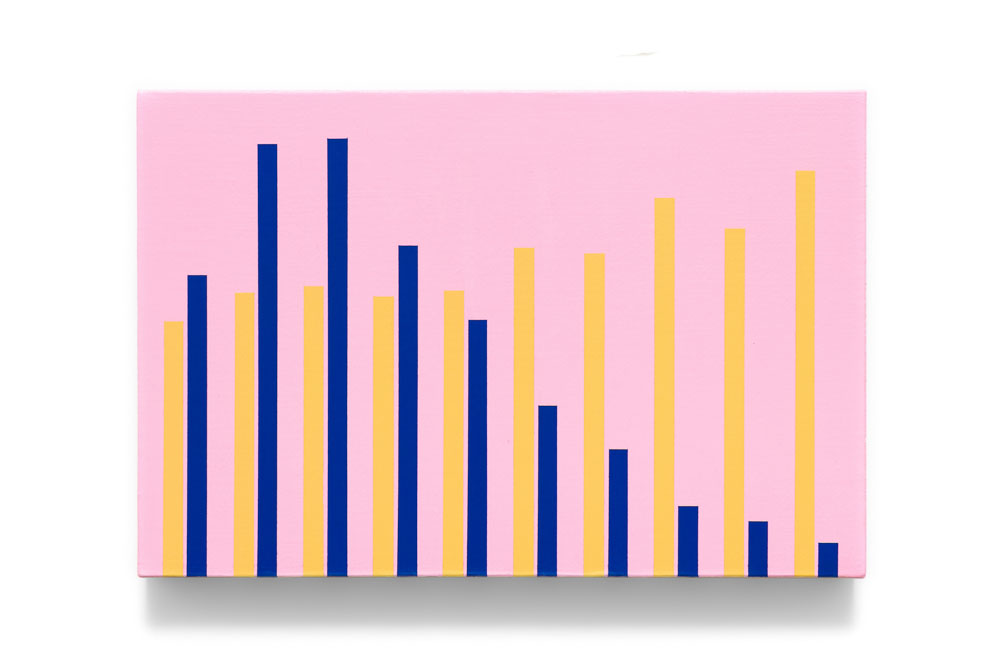
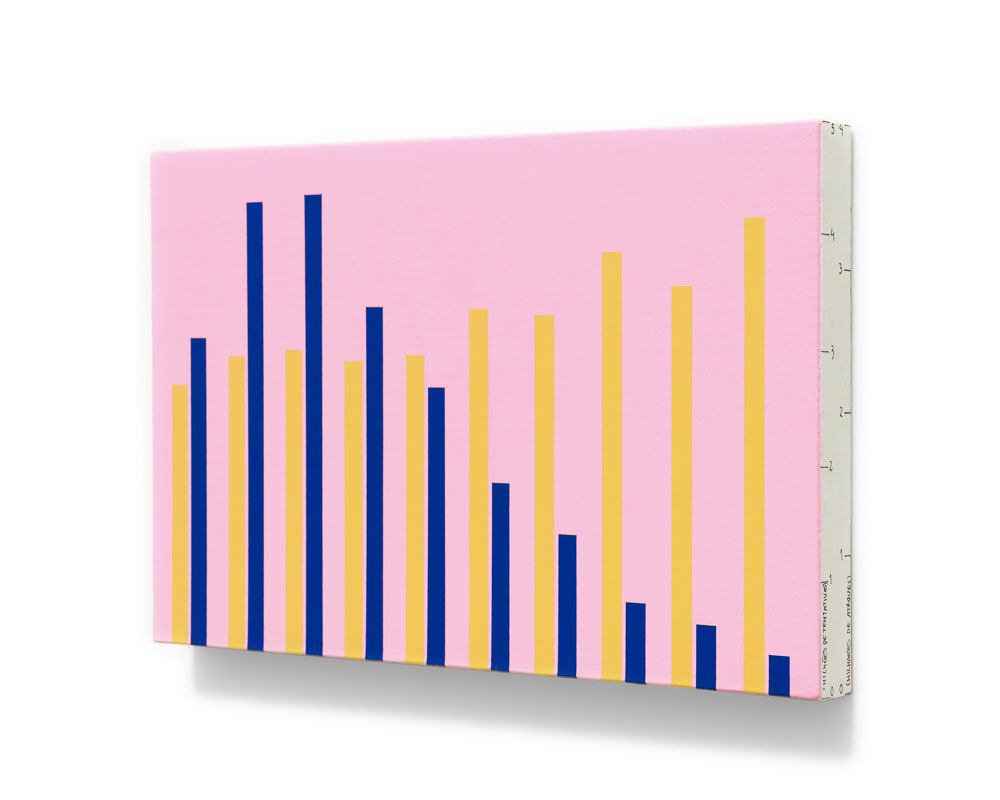
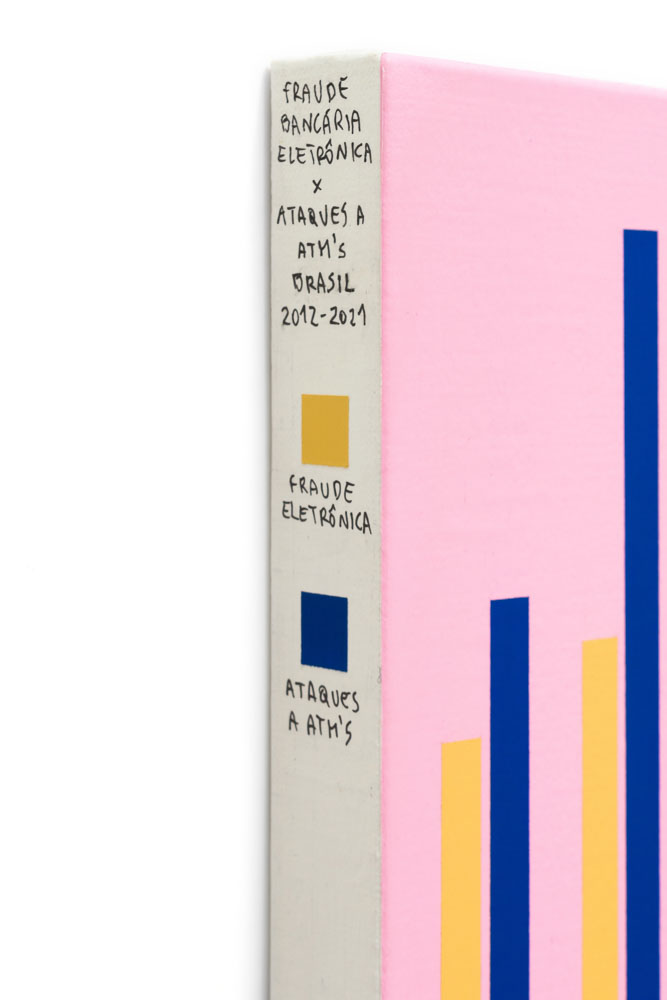
Untitled #37 (Electronic banking fraud x ATM attacks, 2012-2021)
acrylics, ink marker, and varnish on canvas
20×30 cm
2022
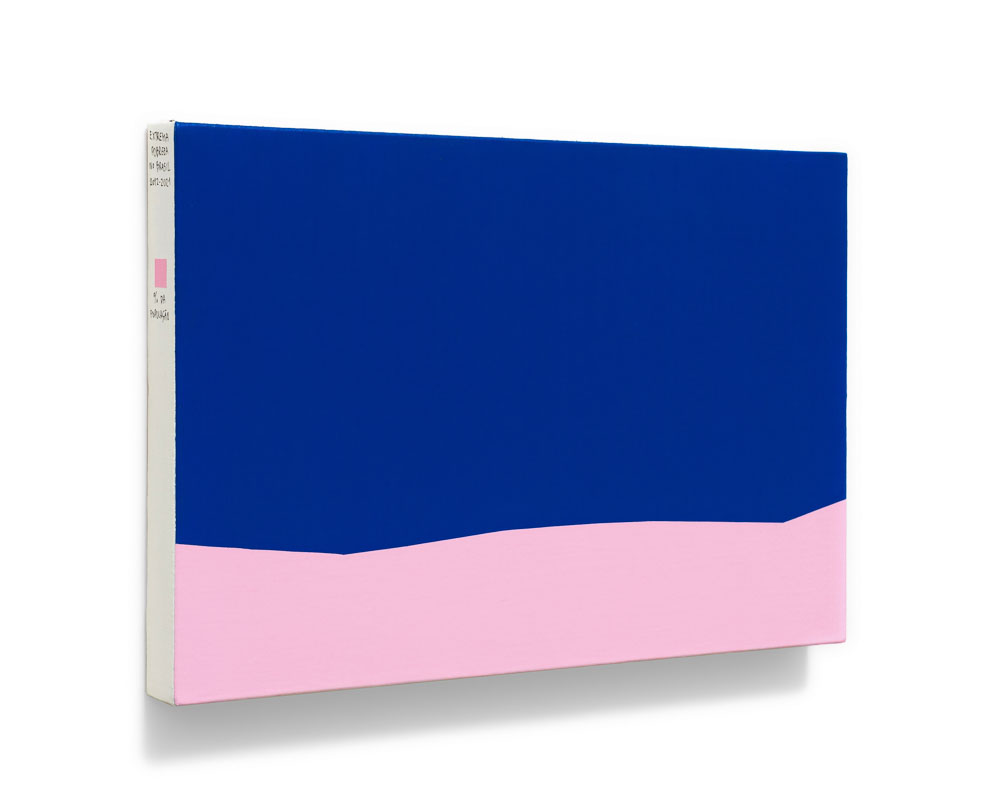
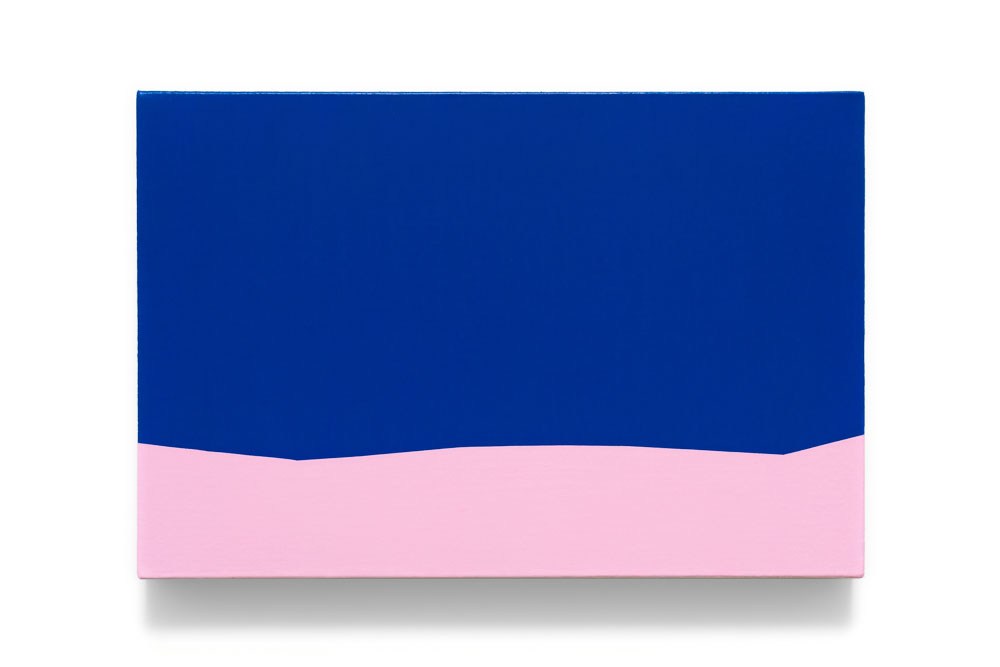
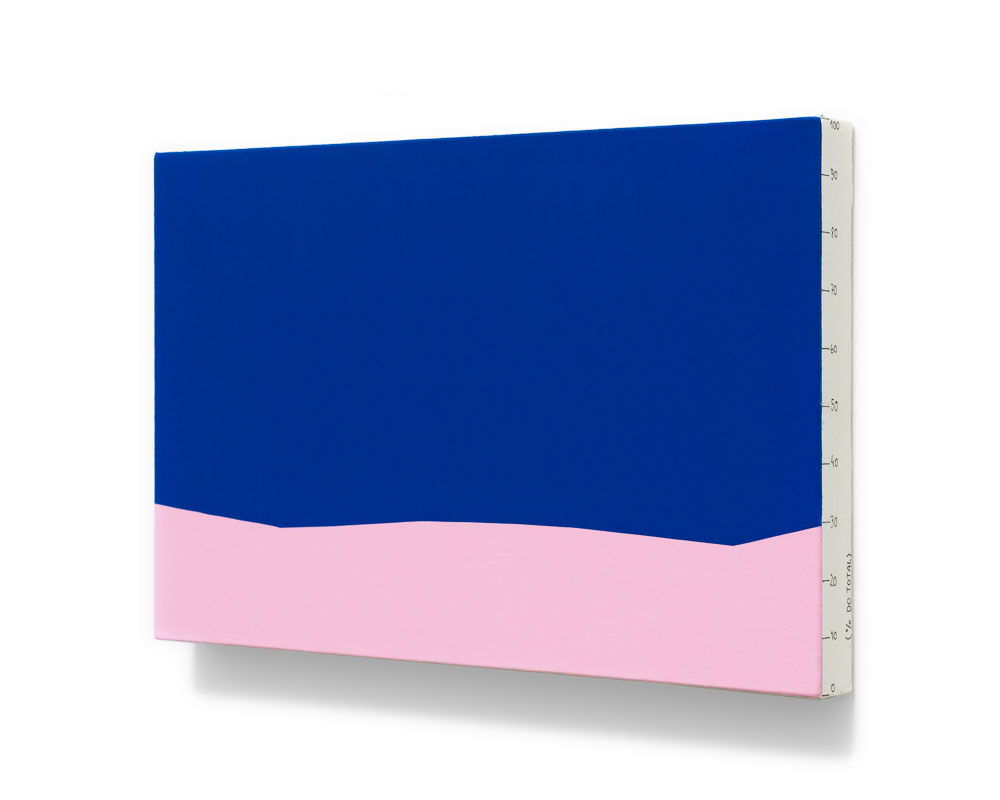
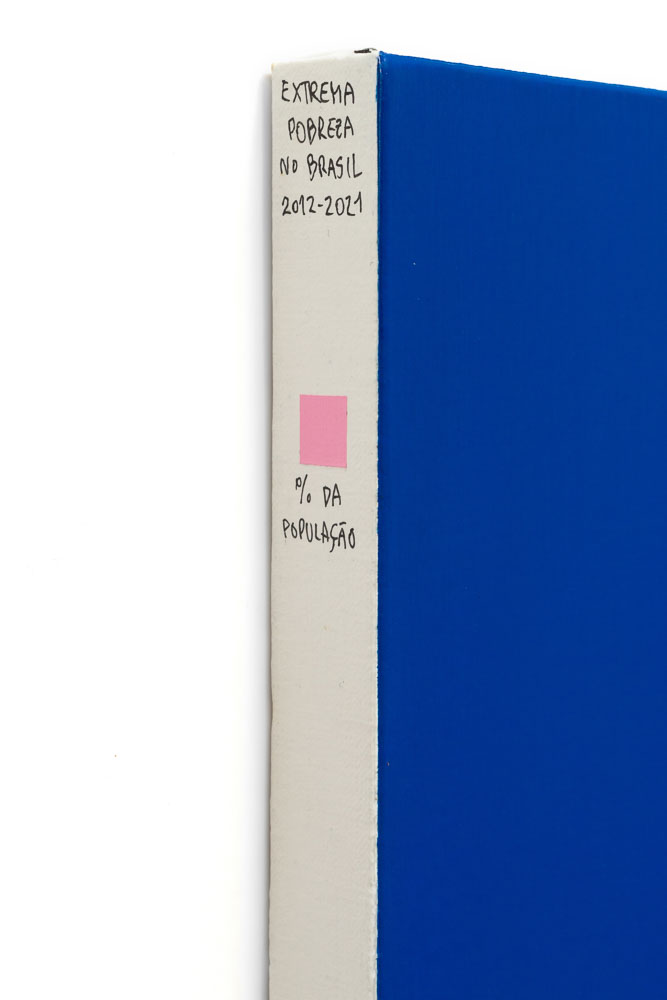
Untitled #38 (Extreme poverty in Brazil, 2012-2021)
acrylics, ink marker, and varnish on canvas
20×30 cm
2022
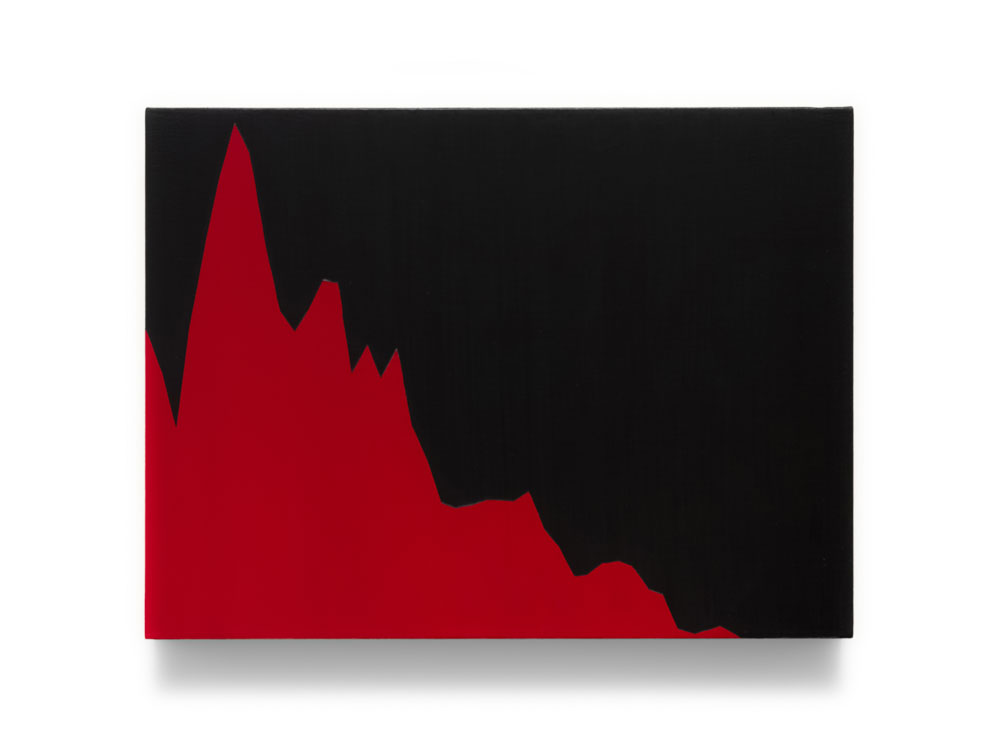
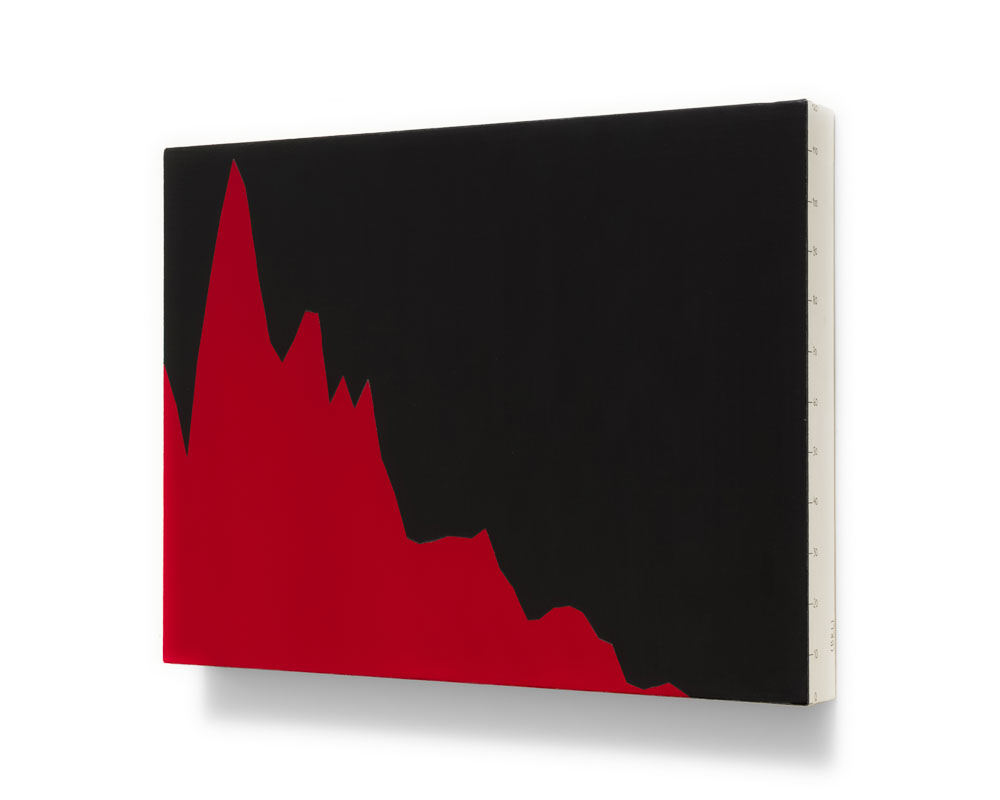
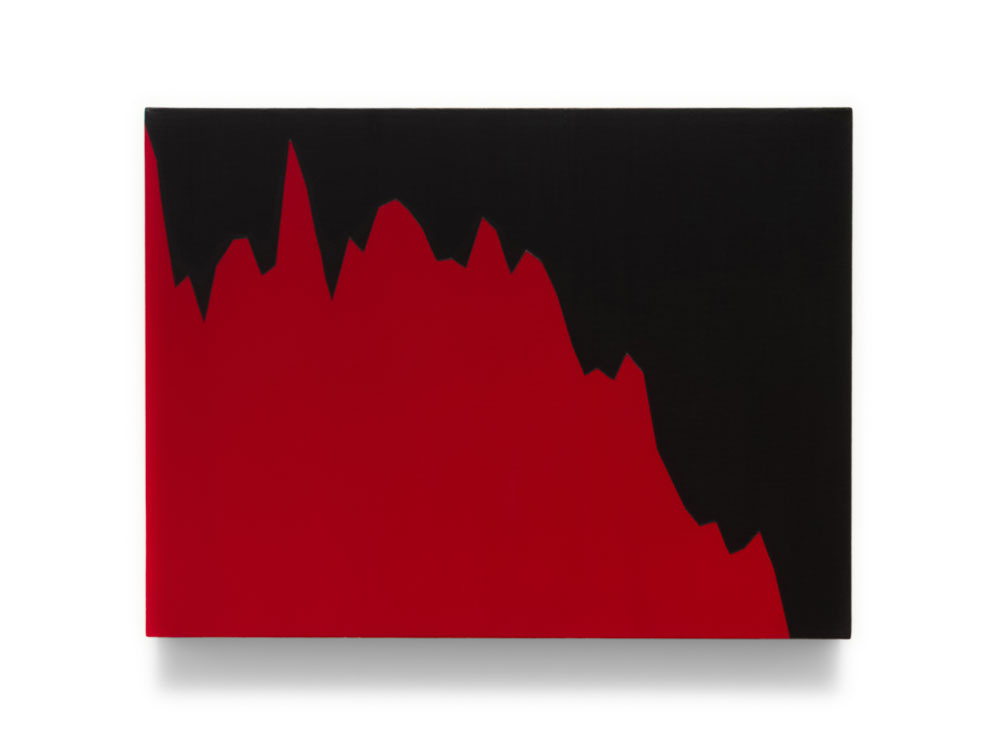
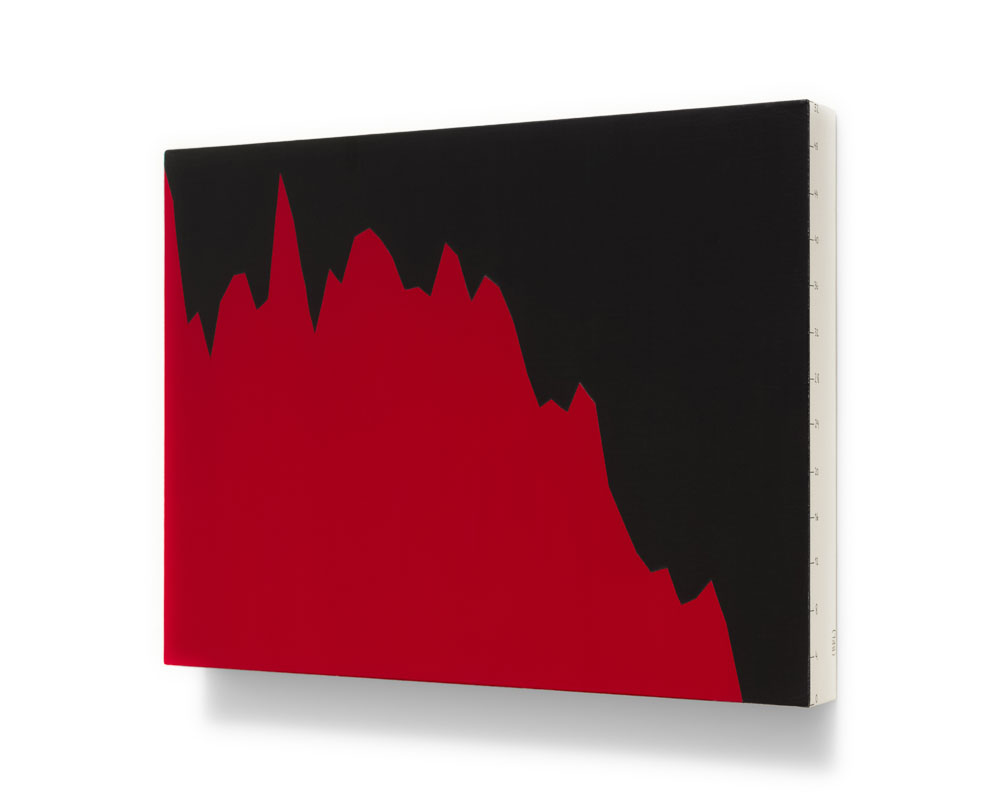
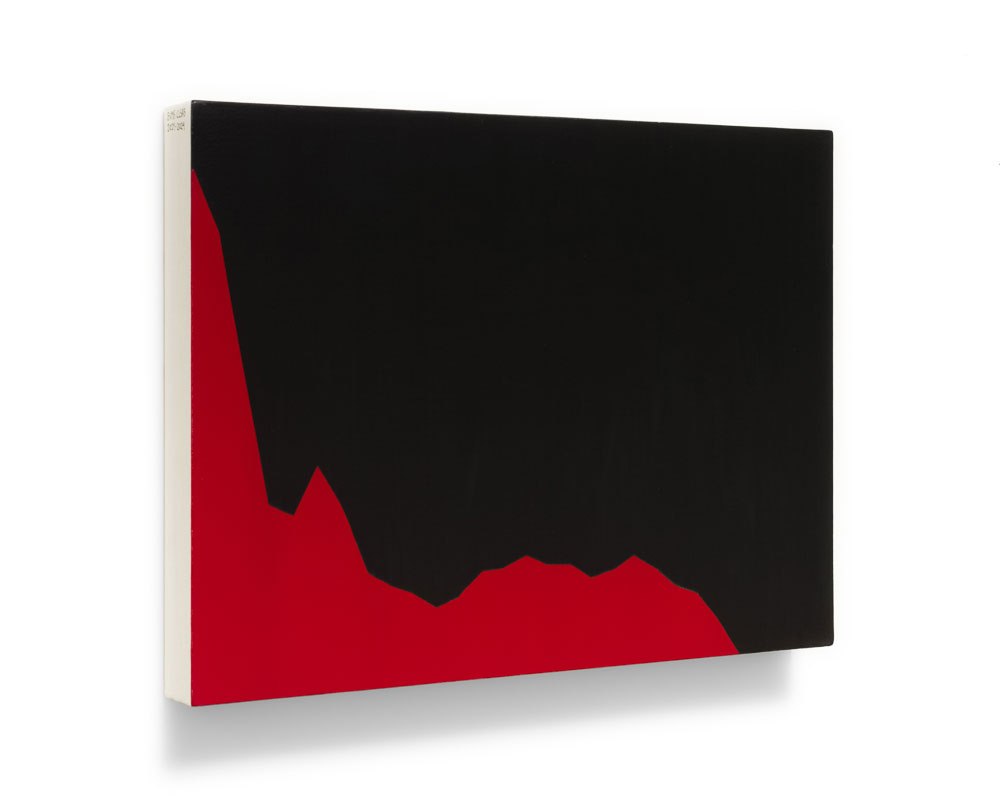
The paintings Untitled #39, #40, and #41 document (and forecast to “0” until the end of 2024) the decreasing stock price of three companies that have a high share control in the hands of Jorge Paulo Lemann, Carlos Alberto Sicupira, and Marcel Telles, partners of the multi-billion dollar firm 3G Capital. After the discovery of corporate fraud with accounting statements, Americanas SA entered judicial recovery, becoming an example of the failure of Brazilian messianic capitalism.
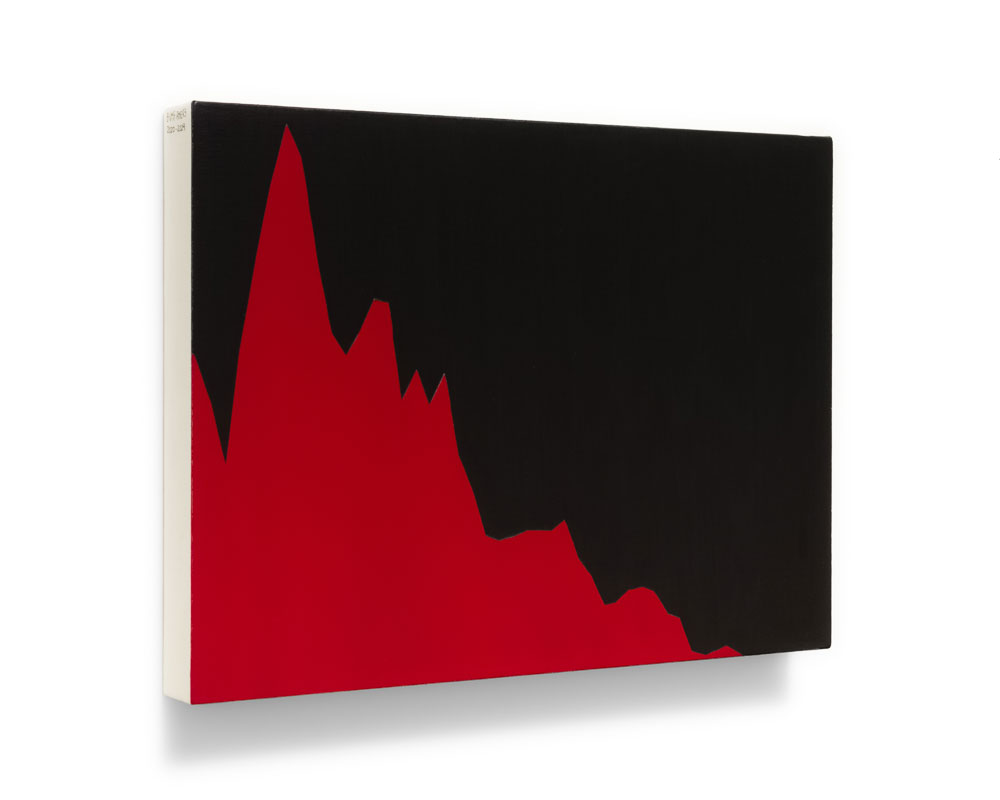
Untitled #39 (Americanas SA, BVMF: AMER3, 2020-2024)
acrylics, ink marker, and varnish on canvas
30x40cm
2023
Untitled #40 (São Carlos Empreendimentos e Participações SA, BVMF: SCAR3, 2020-2024)
acrylics, ink marker, and varnish on canvas
30x40cm
2023
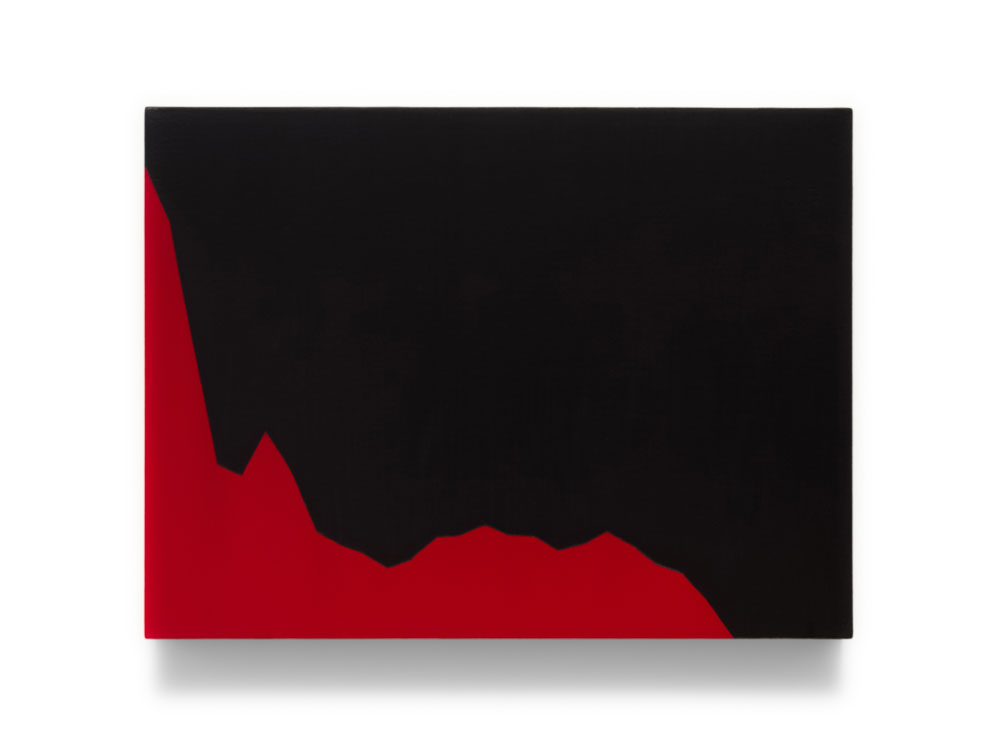
Untitled #41 (ClearSale SA, BVMF: CLSA3, 2021-2024)
acrylics, ink marker, and varnish on canvas
30x40cm
2023
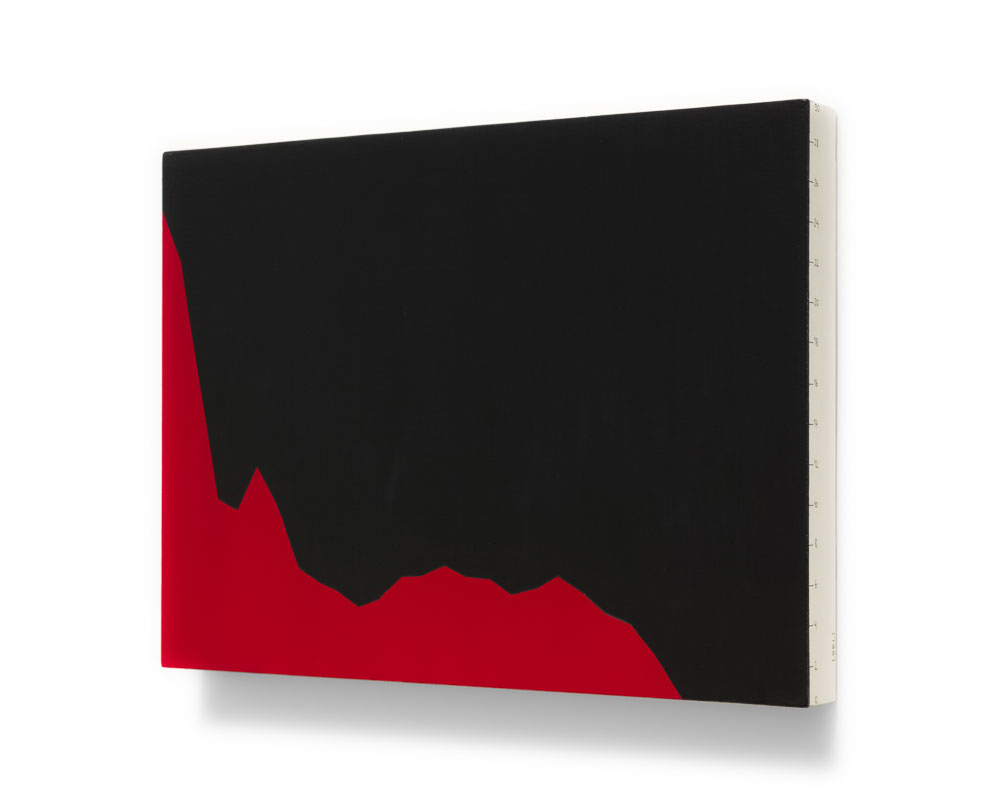
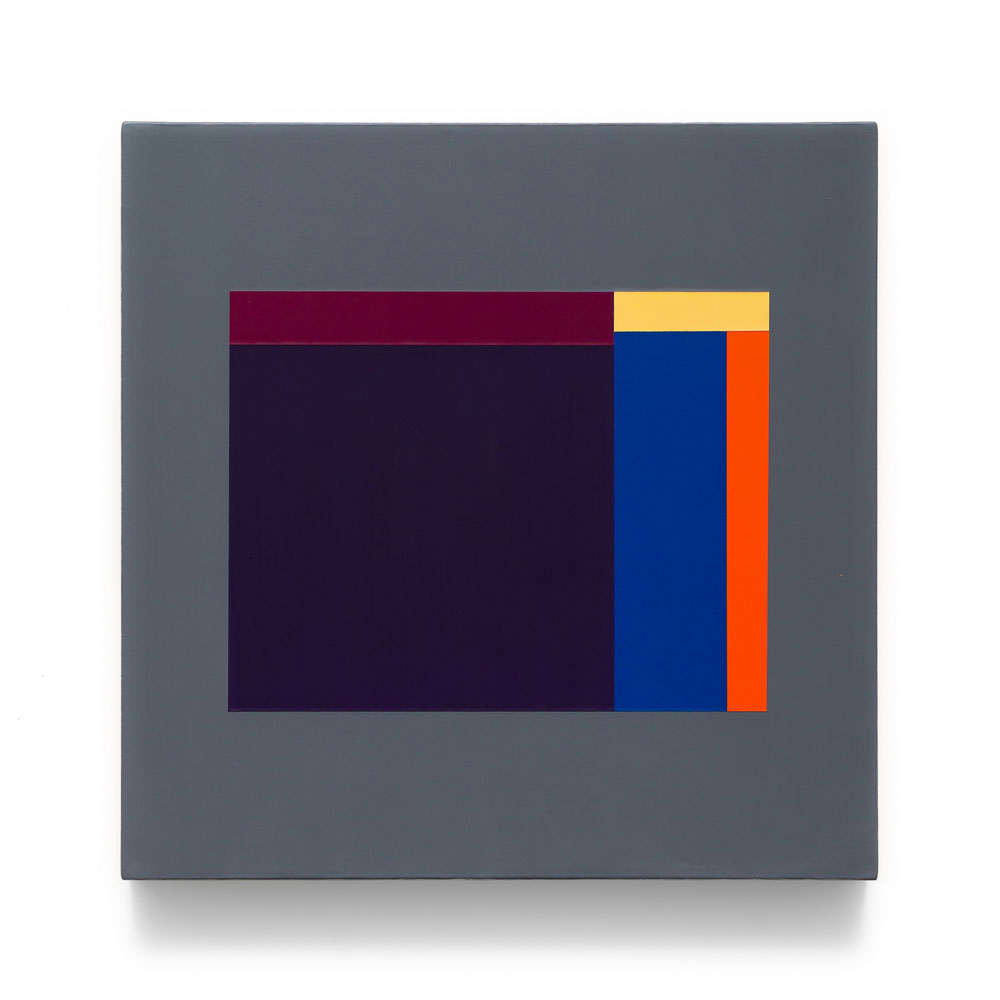
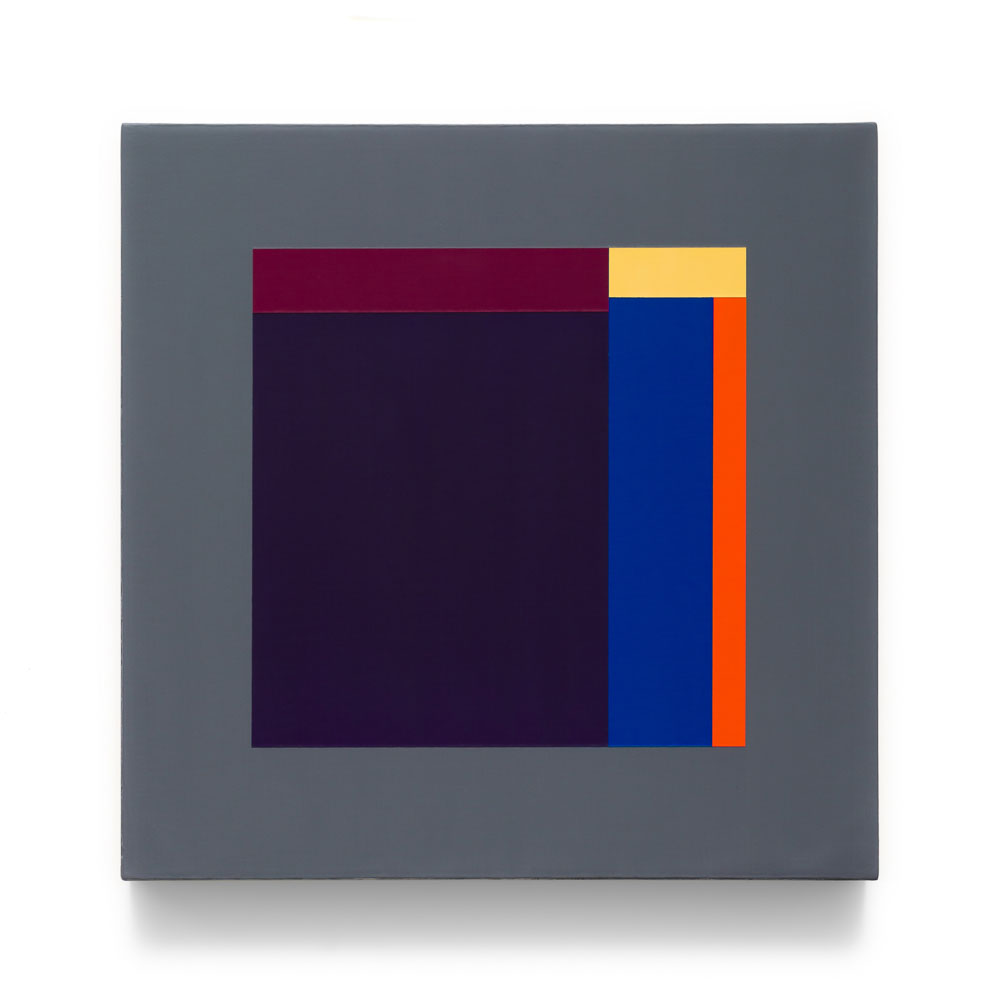
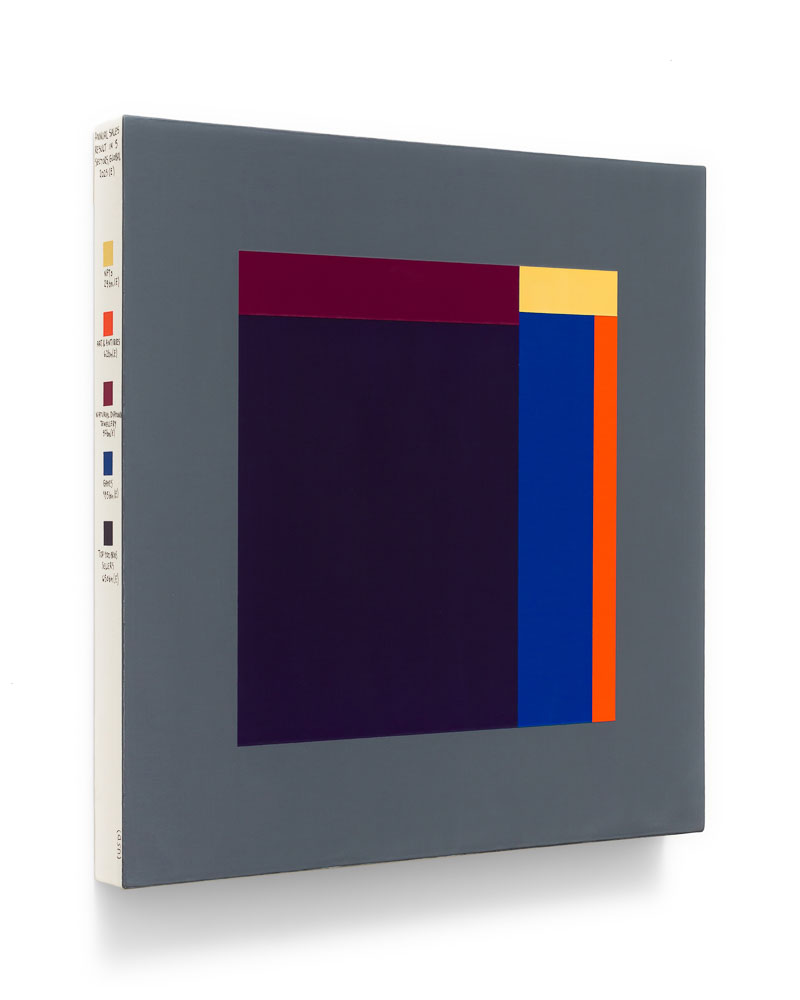
The set Untitled #42 to #47 shows the evolution of the annual sales results in five sectors for which the idea of collecting is implied: non-fungible tokens, art and antiques, natural diamond jewelry, video games, and weapons; based on data from sectoral reports between the years 2019 to 2021. The compositions #45, #46, and #47 provide estimates for the years 2022, 2023, and 2024.
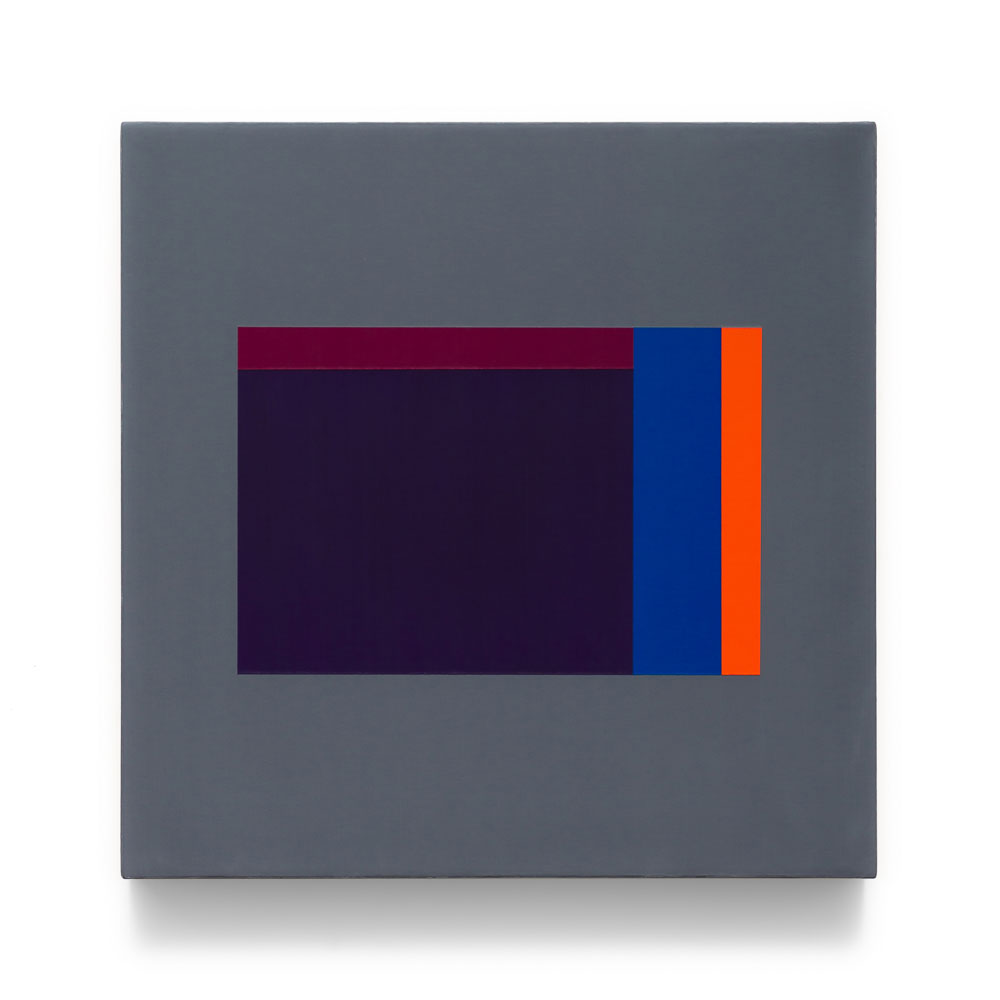
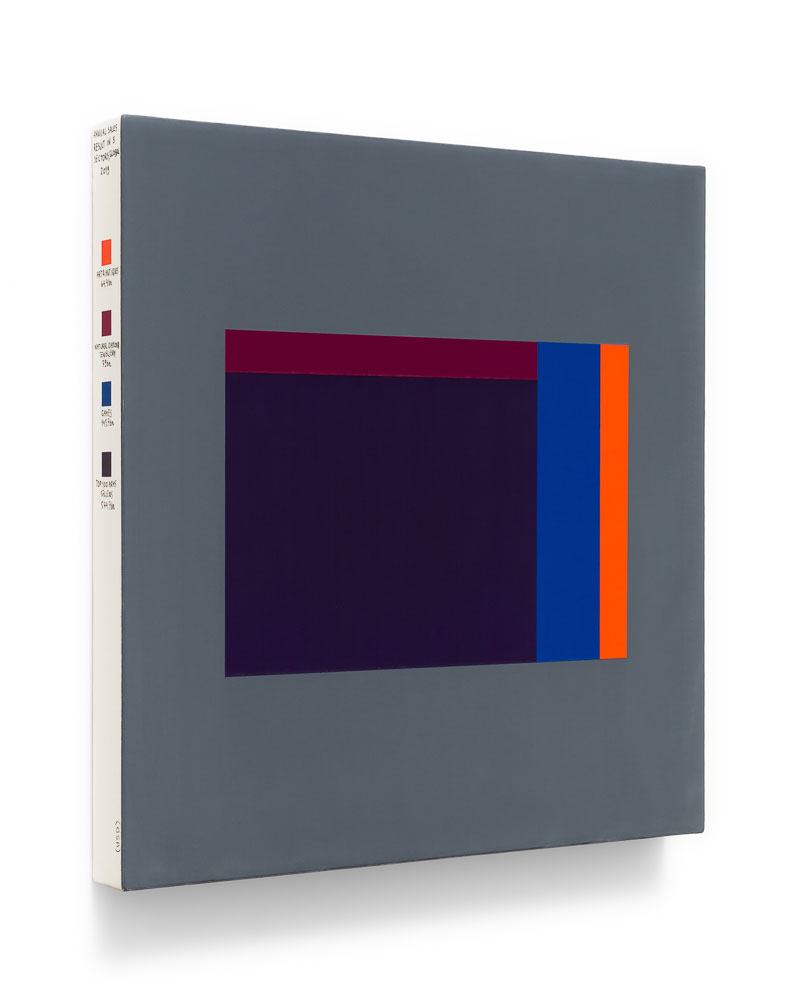
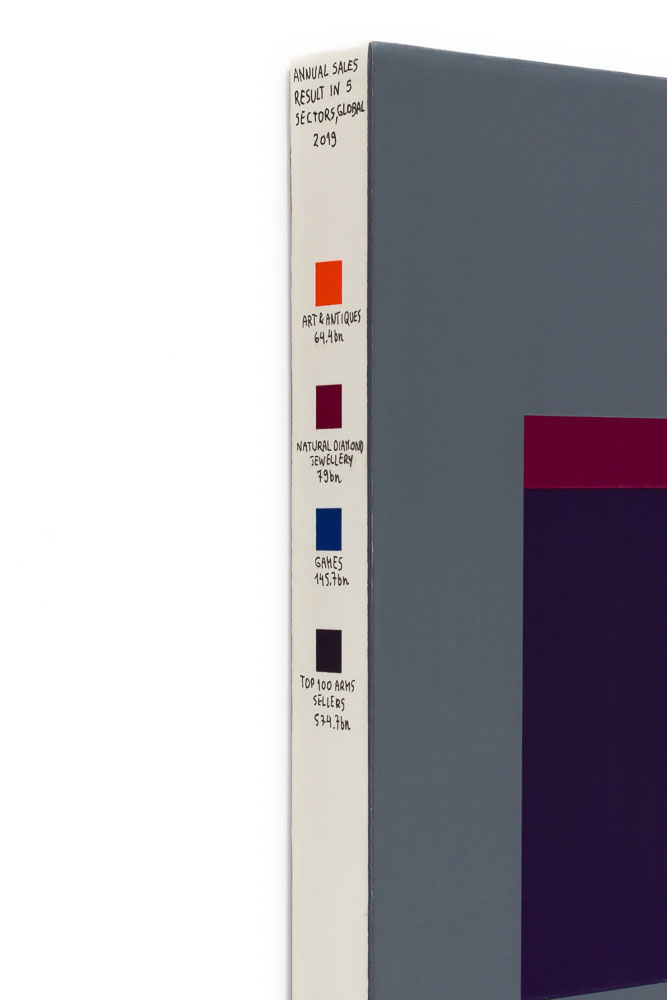
Untitled #42 (Annual sales result in 5 sectors, Global, 2019)
acrylics, ink marker and varnish on canvas
30×30 cm
2023
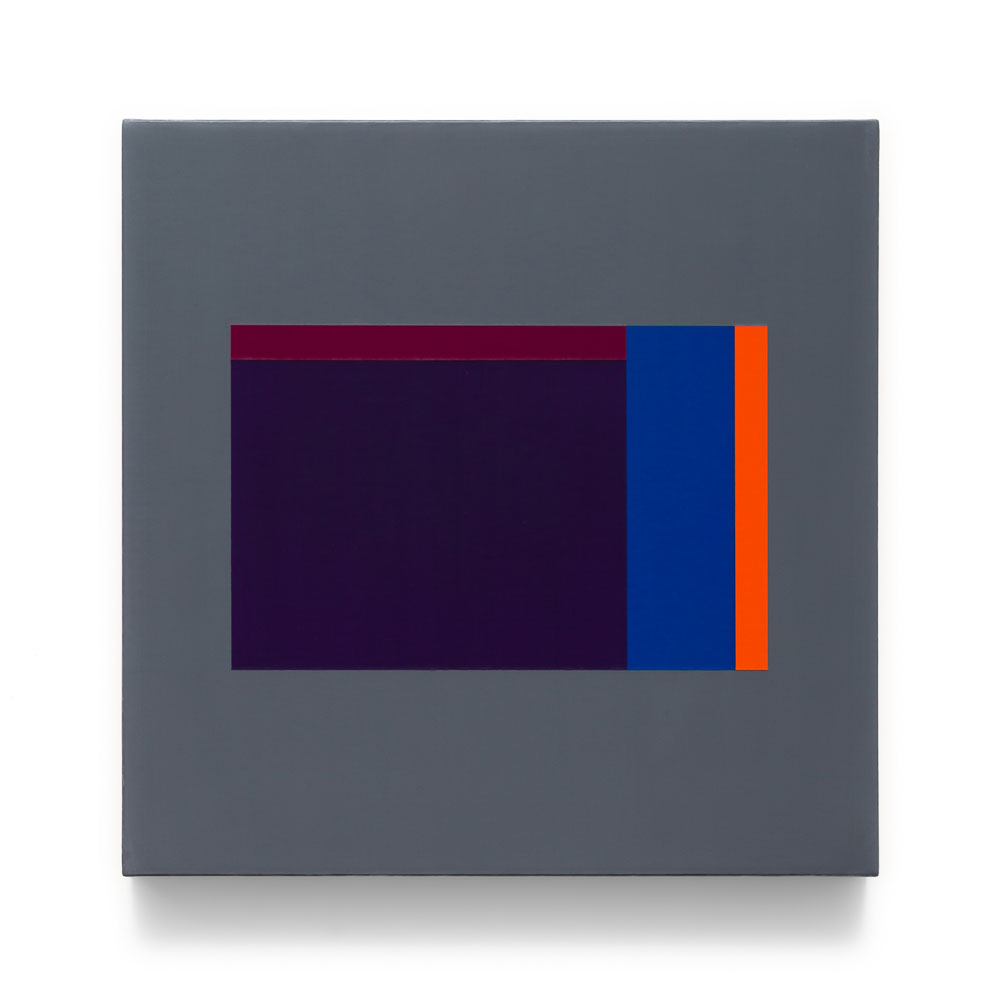
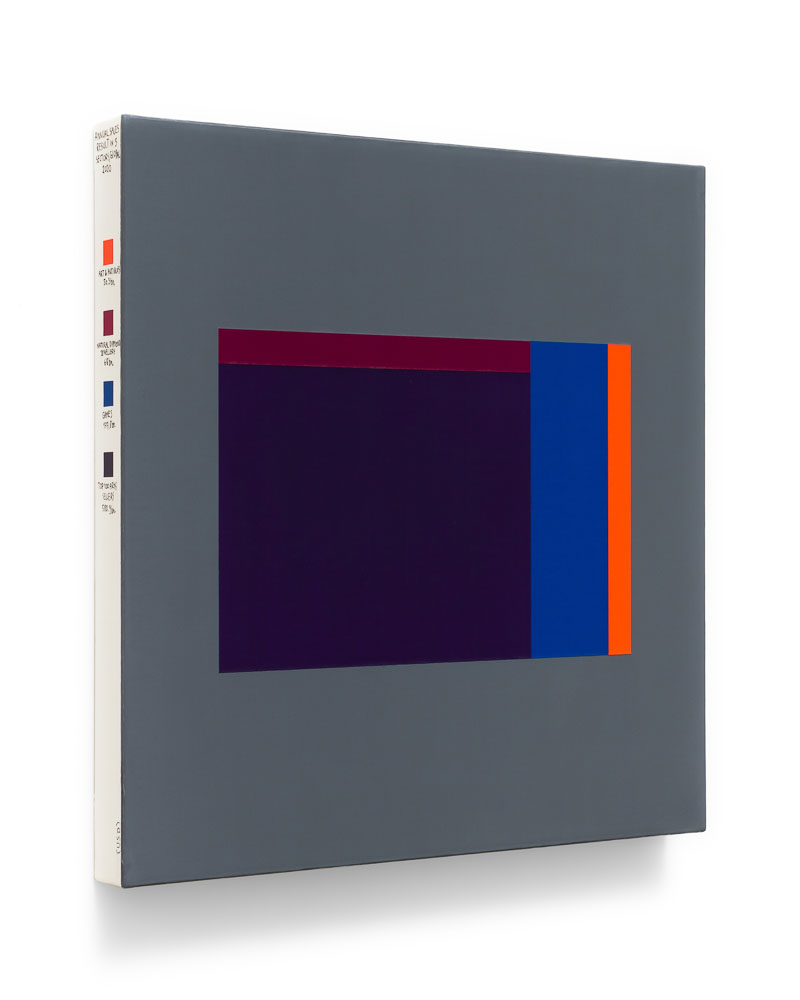
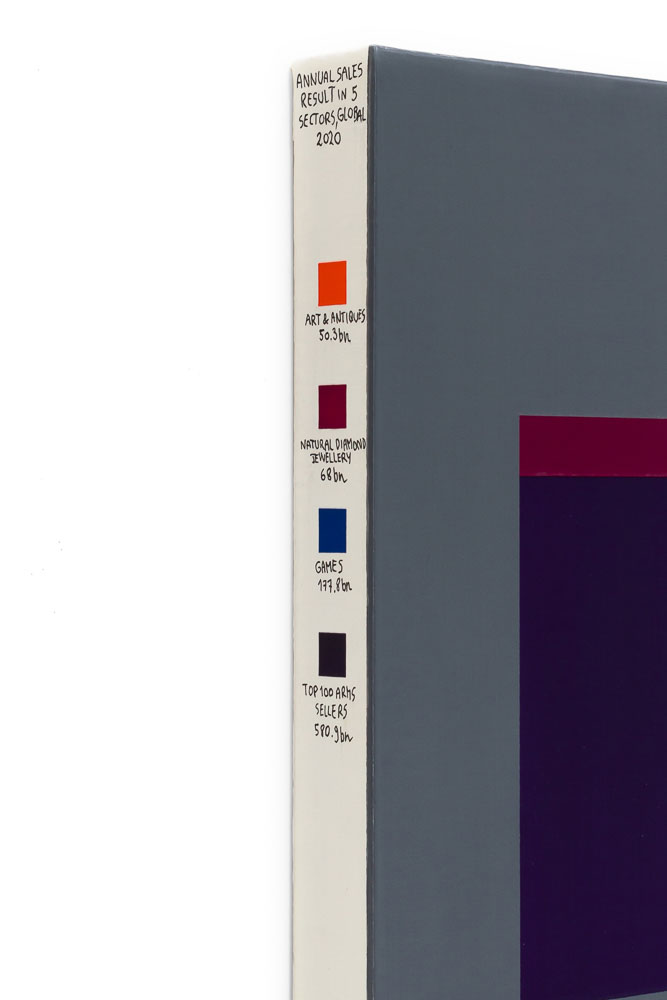
Untitled #43 (Annual sales result in 5 sectors, Global, 2020)
acrylics, ink marker and varnish on canvas
30×30 cm
2023
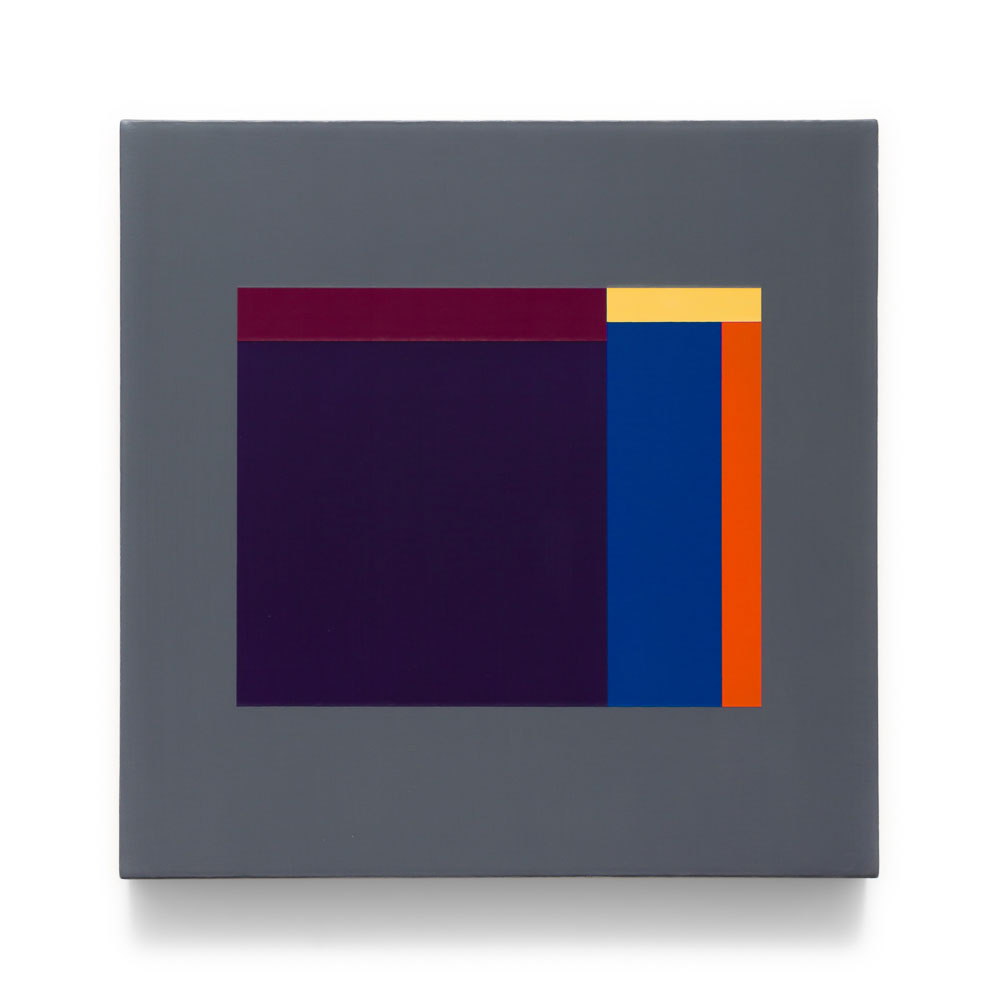
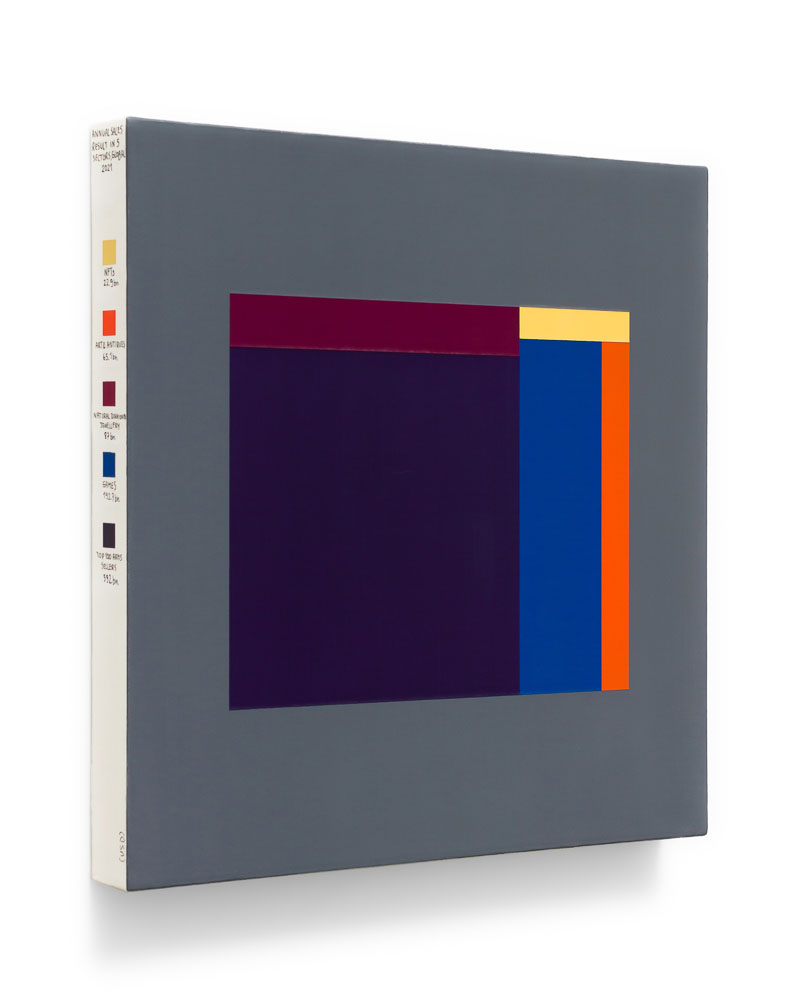
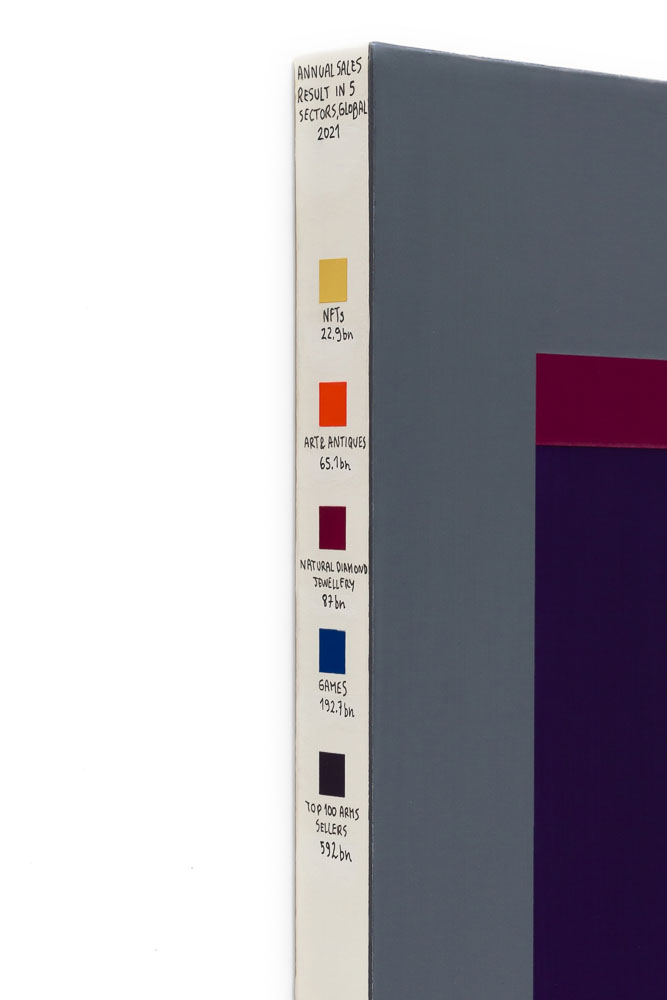
Untitled #44 (Annual sales result in 5 sectors, Global, 2021)
acrylics, ink marker and varnish on canvas
30×30 cm
2023
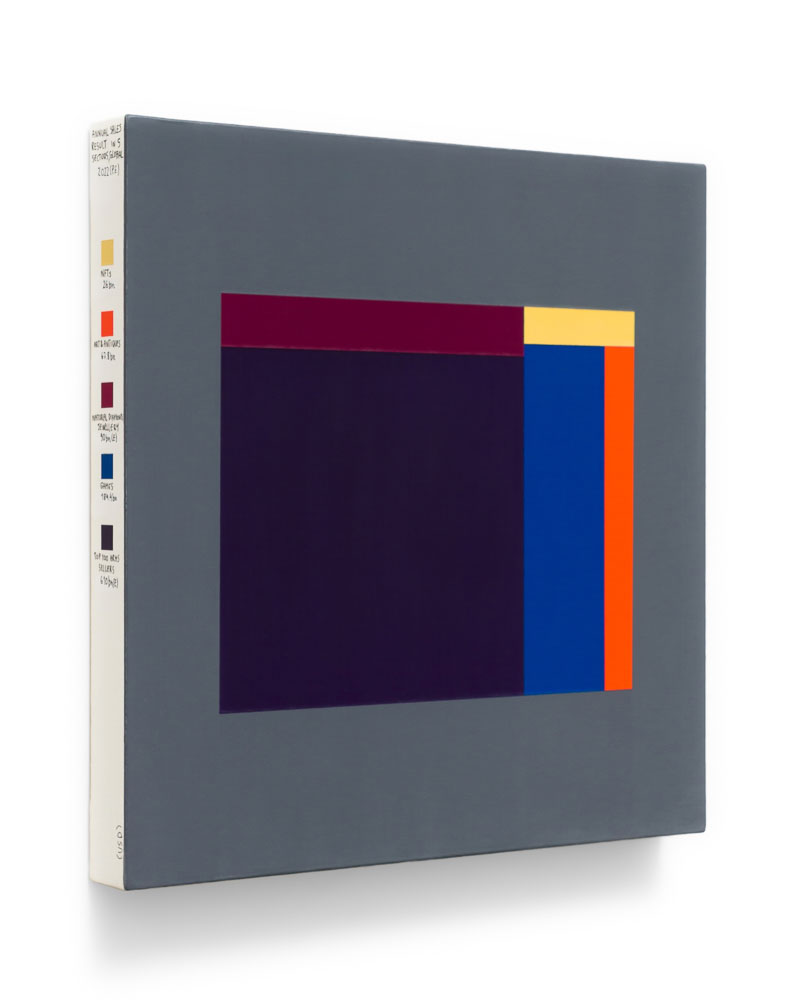
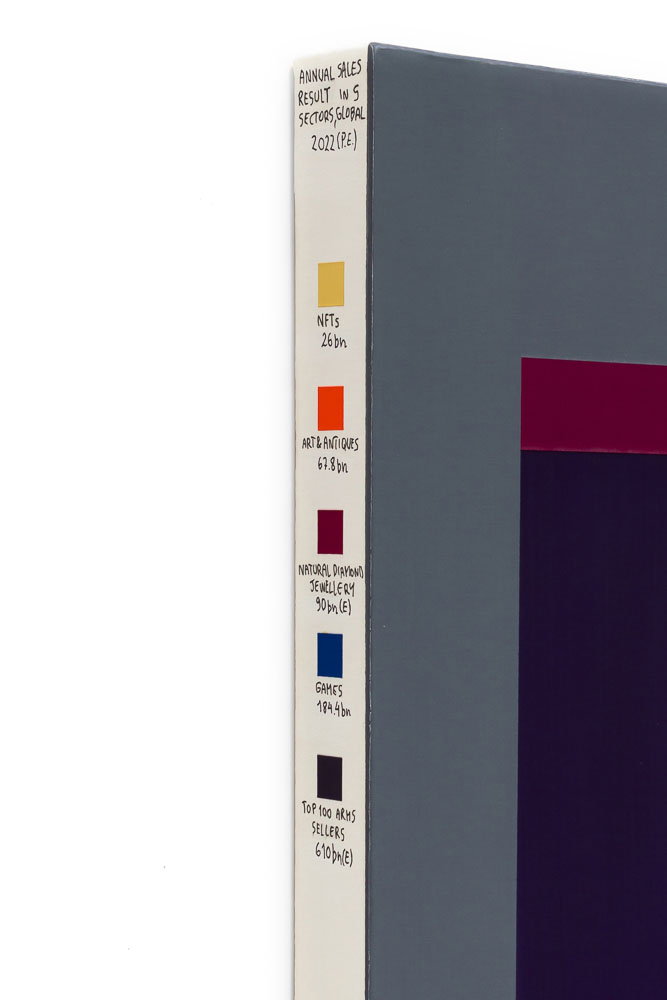
Untitled #45 (Annual sales result in 5 sectors, Global, 2022, partial estimate)
acrylics, ink marker and varnish on canvas
30×30 cm
2023
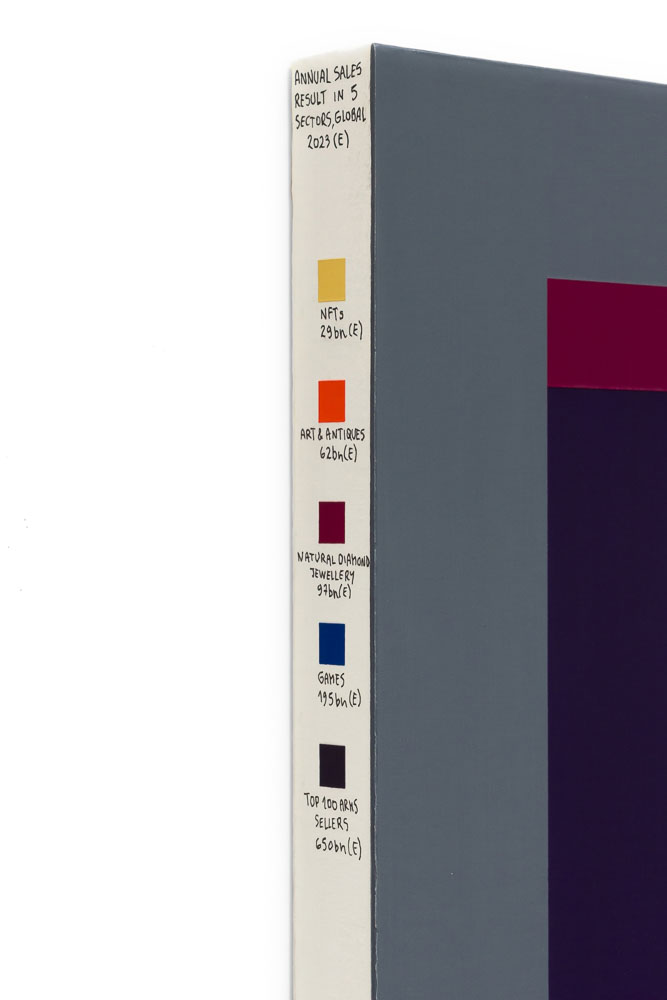
Untitled #46 (Annual sales result in 5 sectors, Global, 2023, estimate)
acrylics, ink marker and varnish on canvas
30×30 cm
2023
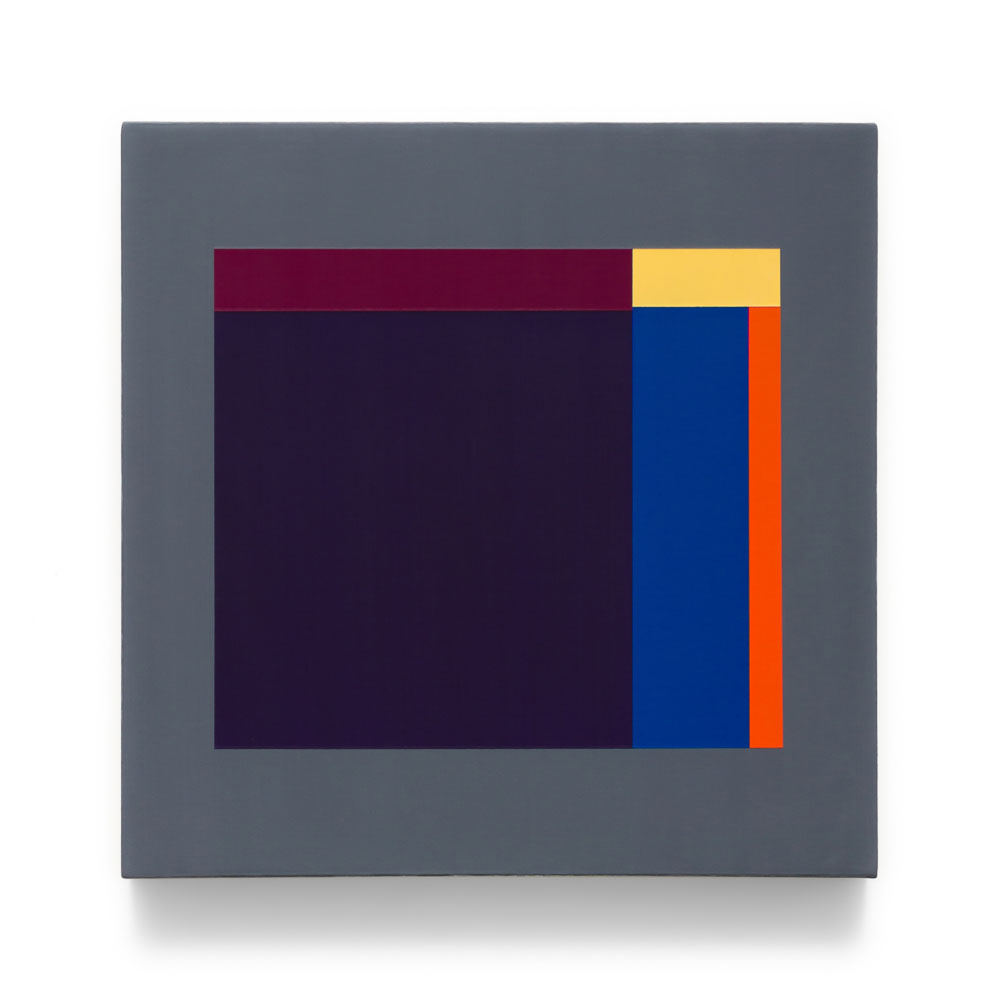
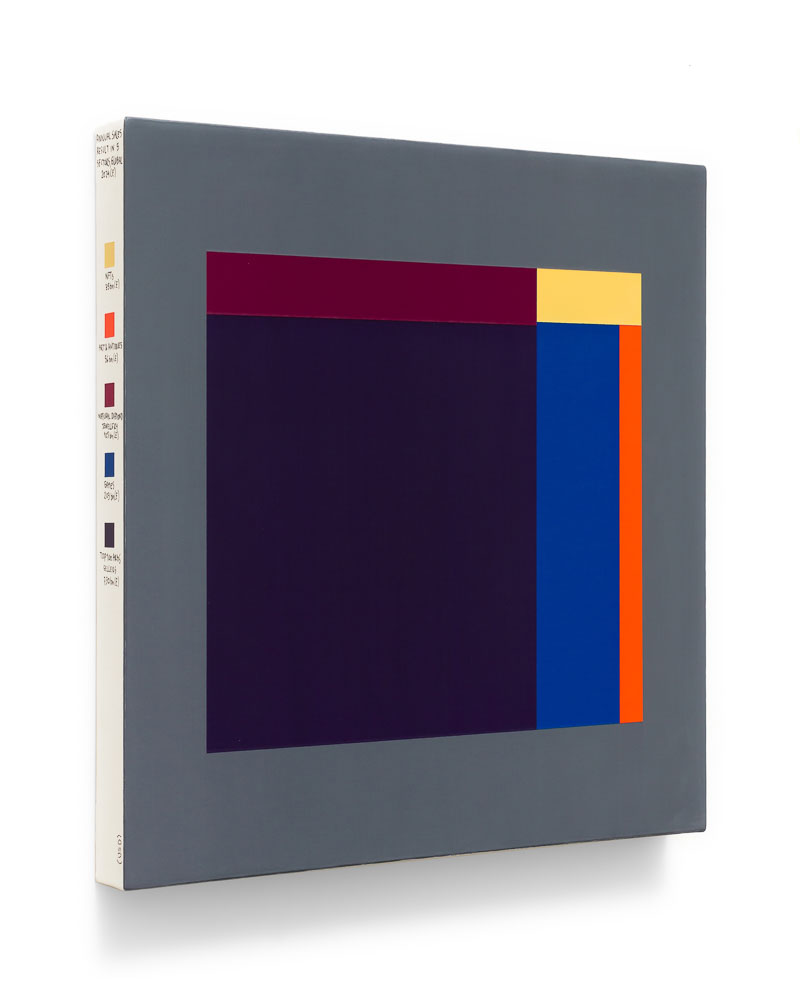
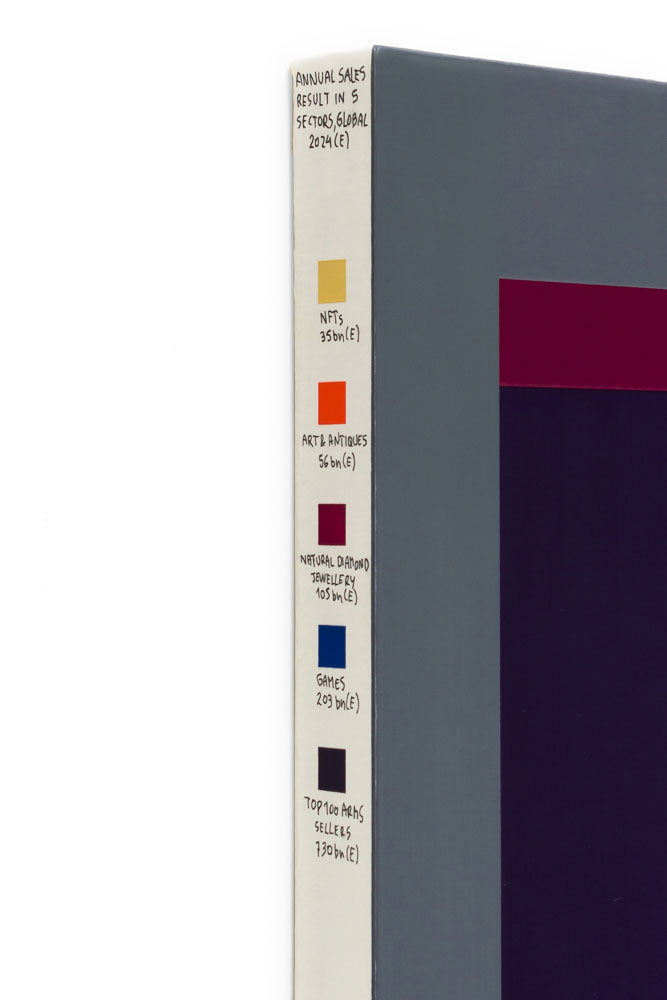
Untitled #47 (Annual sales result in 5 sectors, Global, 2024, estimate)
acrylics, ink marker and varnish on canvas
30×30 cm
2023